Tropical Cyclone Module
- Kester Scandrett
- Former user (Deleted)
- Duy Pham
The extreme and rapid changes in atmospheric pressure and wind fields in a tropical cyclone may strongly influence hydrodynamics and waves in a water body, especially in nearshore areas. Storm surges induced by pressure depletion and strong winds tend to pile up water against the shore; subsequent coastal inundation and erosion can cause severe damage. Beyond the flooding issues due to cyclones, modeling their environmental impacts from erosion, spills, and contaminant transport are essential.
The Tropical Cyclone Module allows the user to import, and edit tropical cyclone tracks and data from a range of different sources. These tracks can then be displayed and managed in EE before running EFDC+ to compute the impact of the cyclone wind and pressure fields on the model hydrodynamics.
Cyclone Models in EFDC+
With this module, EFDC+ will internally generate the cyclone fields during the simulation using very lightweight cyclone track data and a parametric cyclone model. Four existing models address tropical cyclones:
- Holland (1980)
- Hubbert et al. (1991)
- McConochie et al. (2004) and
- Willoughby et al. (2006).
All four of these approaches are available in the new EEMS Tropical Cyclone module. The Holland (1980) model uses symmetric pressure and gradient wind profiles without the inflow angle. Hubbert et al. (1991) is a variation on the Holland (1980) model but applies a constant inflow angle and bearing of the maximum wind speed relative to the cyclone’s direction of movement.
The McConochie et al. (2004) model is similar to Hubbert et al. (1991) but uses a distance-dependent inflow angle and a wind speed-dependent boundary layer coefficient. In Willoughby et al. (2006), the gradient wind speed profile is determined based on the tangential wind component in the eye and the one beyond the transition zone. See the EFDC+ Theory Document for further details on these models.
Pre-processing Data in EFDC+ Explorer
EFDC+ Explorer (EE) allows the user to import cyclone tracks in different formats. The pre-processing steps in EE include visualizing, editing, filling in the missing data, and other steps.
A number of online data sources are available to provide forecasts and archives of cyclone tracks. Some of the cyclone track formats supported by EEMS are:
– NOAA (National Oceanic and Atmospheric Administration of the United States)
Cyclone tracks are provided in HURDAT2 format with two datasets: the Atlantic hurricane database for 1851-2020 and the Northeast and North Central Pacific hurricane database for 1949-2020.
– JTWC (Joint Typhoon Warning Center of the U.S Navy)
The JTWC best track data source includes the following datasets: Southern Hemisphere (1945-2019), Northern Indian Ocean (1945-2019), and Western North Pacific Ocean (1945-2019).
– RSMC (Regional Specialized Meteorological Centre)
Six regional centers provide cyclone track forecasts and archives for different regions around the world as shown in Table 1 below.
The Graphical User Interface (GUI) for the Tropical Cyclone module in EE can be activated from the Wind Forcing entry in the Hydrodynamics module, as shown in Figure 1. A dropdown list allows you to select the parametric cyclone model as shown in Figure 2, including:
- Holland (1980),
- Hubbert et al. (1991),
- McConochie et al. (2004), and
- Willoughby et al. (2006).
To use a tropical cyclone model, select from the drop-down list as shown in Figure 2.
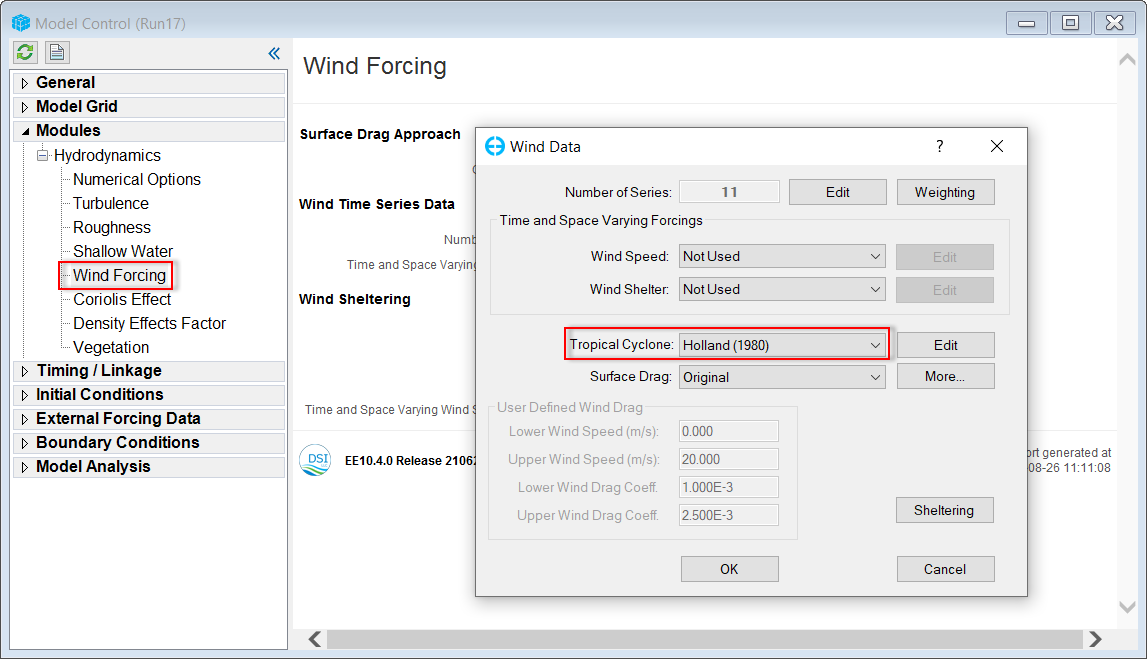
Figure 1. Activate the Cyclone Module.
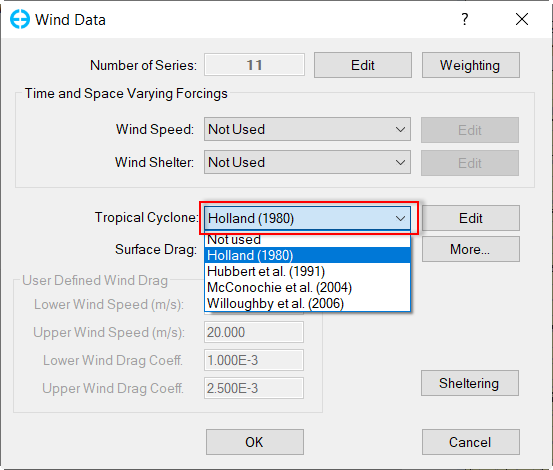
Figure 2. Cyclone Model selection.
To edit the selected cyclone module, the user clicks on the Edit button, then the Tropical Cyclone Module will be displayed as shown in Figure 3:
- Cyclone Model: this field contains the selected cyclone models as described above and in the Figure 2.
- Number of Tracks: this shows the number of cyclone tracks that have been imported.
- Base Date: It will be taken from the EFDC+ model's base date (e.g 2005-01-01).
- In the General tab, the default values are filled for air density, ambient pressure, and the bearing angle of maximum wind speed relative to the forward direction of the cyclone. However, the user can modify these fields' values. The value for UTM Zone is taken from the UTM Zone of the model set. (see Figure 4)
- In the Tracks tab, It shows information on the selected cyclone track as Number of Points and track properties. The Figure 5 shows the Tracks tab without any tracks imported.
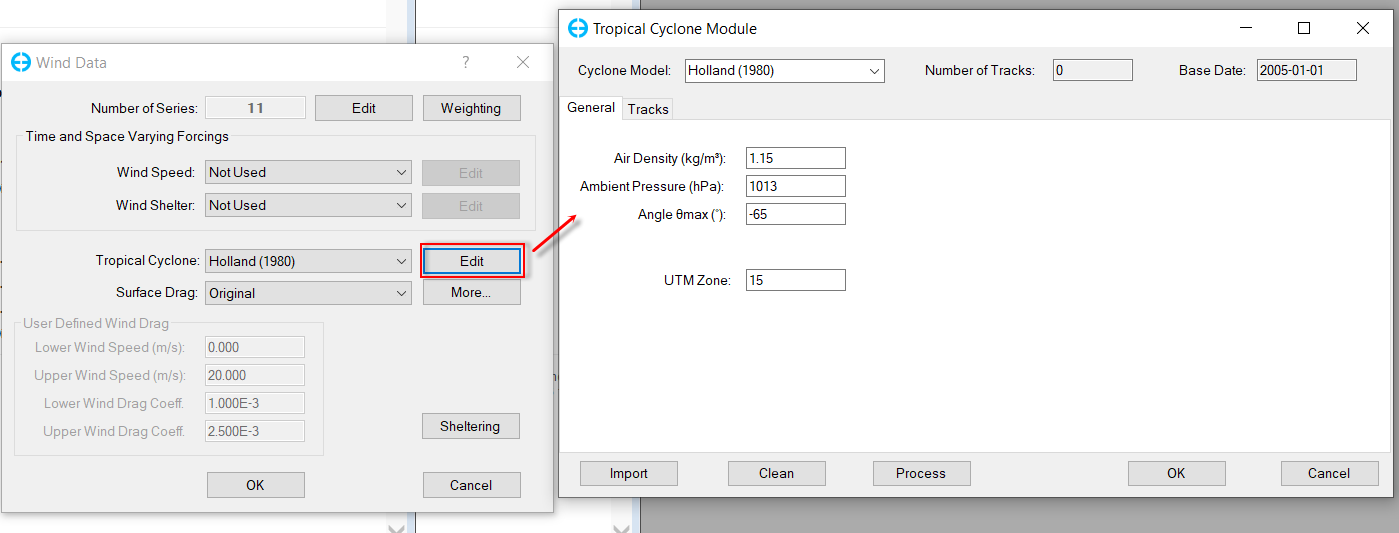
Figure 3. Tropical Cyclone Module form.
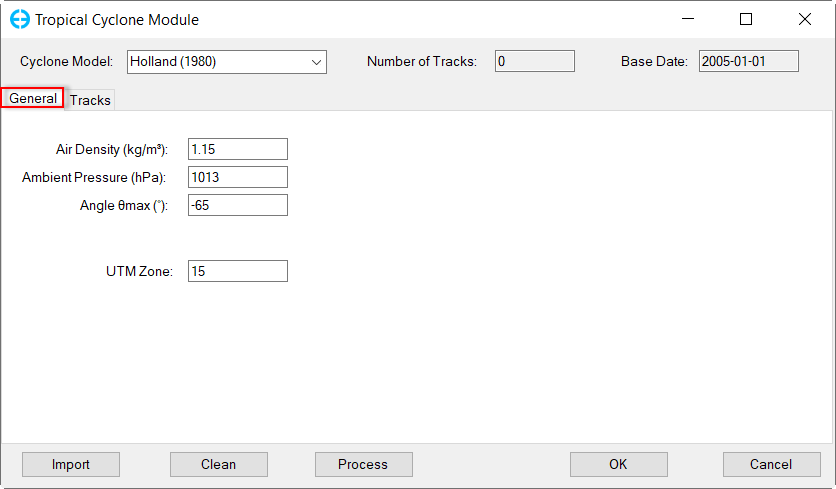
Figure 4. Tropical Cyclone Module: General tab.
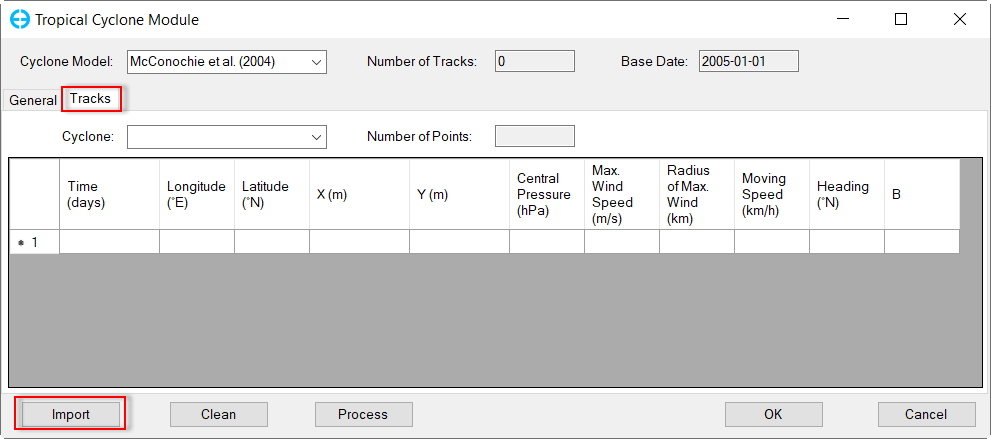
Figure 5. Tropical Cyclone Module: Tracks tab.
Import Tropical Cyclone Tracks
To import cyclone tracks from external sources, click the Import button as shown in Figure 5. Then follow the steps described below to start importing cyclone tracks from the Cyclone Tracks form as shown in the Figure 6.
- Select the data format by clicking on the drop-down list. Three data formats can be selected from here (e.g NOAA Best Track Data).
- Click the Browse button to browse the data file of the cyclone track
- Click the Import button to start importing the cyclone track file. If the user wants to import all track files in the same folder, check the Import All Files in Directory box before clicking the Import button.
- Once the tracks are imported, the names of tracks will be shown in the Current Track frame. From the drop-down list of Track Name, select a track name, then the property of the selected track will be displayed in the Track Points frame. In case, the -999 value indicates missing values (e.g Rmw column), to fill in the missing values, click the Process button.
If there is a time zone difference between the model and the track data, the user can specify the number of hours to add to the cyclone track time to convert to the model time.
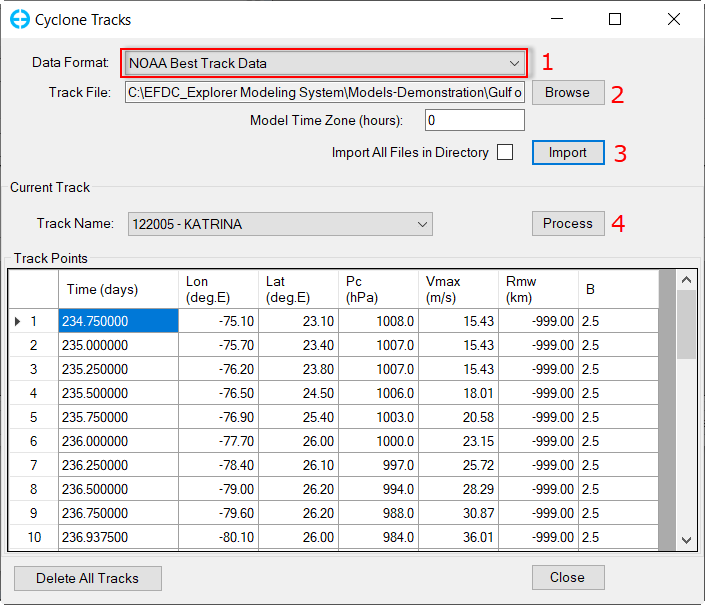
Figure 6. Import Cyclone Tracks.
Process Tropical Cyclone Tracks
Once the cyclone tracks are imported into EE, they can be processed by clicking the Process button. After clicking the Process button, the Process Cyclone Tracks form will be displayed as shown in Figure 7.
- Process All Tracks: when this option is selected the process will be applied to all tracks.
- Track Name: show the current track from the drop-down list if the user wants to process a single track.
- Action: this frame contains four options, and the user only can select one option at a time.
- Compute Translation Speed: with this option, EE will convert the geographic coordinates (latitude and longitude) of the cyclone eye positions to the UTM coordinates using the given UTM zone. The forward-moving speed and heading of the cyclone are also computed.
- Fill Maximum Wind with: this option fills values of maximum wind with one of the four options from the drop-down list such as Dvorak (1984); Holland (1980) and so on.
- Fill Radius of Max. Wind with: this option fills values for the radius of maximum wind (Rmw) with one of the six options from the drop-down list. The Willoughby et al. (2006) model always recomputes the Rmw using the Willoughby and Rahn (2004) formula.
- Fill Holland's shape parameter B with: this option fills values from Holland's shape parameter B with one of the five options from the drop-down list. If the user selects the ''Constant value" option then the user can enter a fixed value for the Constant B (default value is 2.5).
- Fill Options frame: this frame has Only Missing Data Points and All Track Points option which indicates that only the missing data values will be filled and All Track Points option which directs EE to overwrite values of all data points with the newly computed values.
After the user has finished selecting options for filling in the missing track data, click the Process button to start processing. This form can be closed by clicking the Close button.
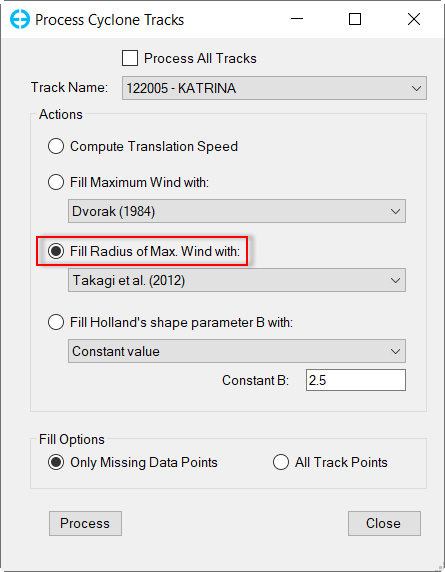
Figure 7. Process Cyclone Tracks.
Figure 8 shows a cyclone track after processing, the -999 value of the "Radius of Max. Wind" column has been replaced by new valid data.
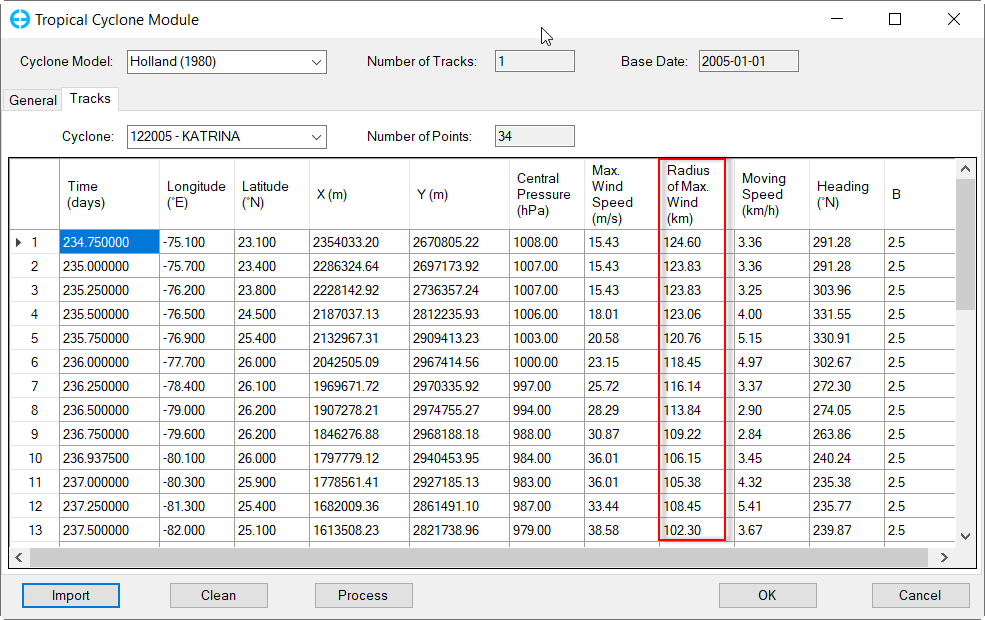
Figure 8. Cyclone Tracks after Processing.
The track of the tropical cyclones which don’t have an influence on the model domain can be removed by using the button. This button cleans the track by removing points outside a certain distance from the model’s center by specifying the distance and clicking the Clean button as shown in Figure 9. Click the OK button on this figure to exit this form and back to the form as shown in Figure 3. Click OK button on the Figure 3 to close the Wind Data form. It is recommended to save the model again to ensure the cyclone module has been activated. After saving the model, the information of the cyclone module is written to C14D of the master control file efdc.inp. (see Figure 10)
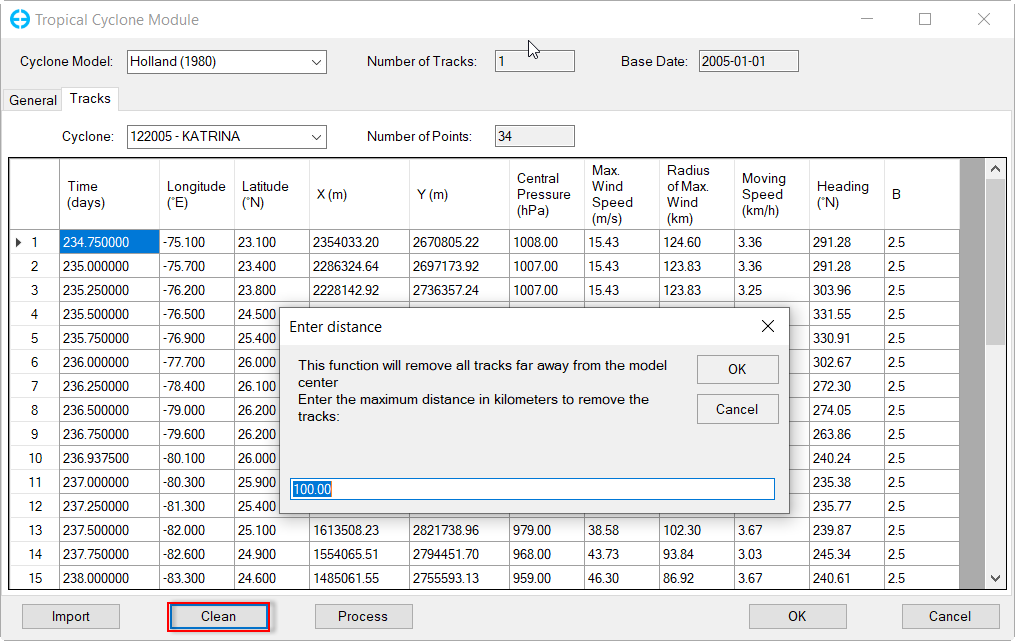
Figure 9. Clean cyclone tracks.
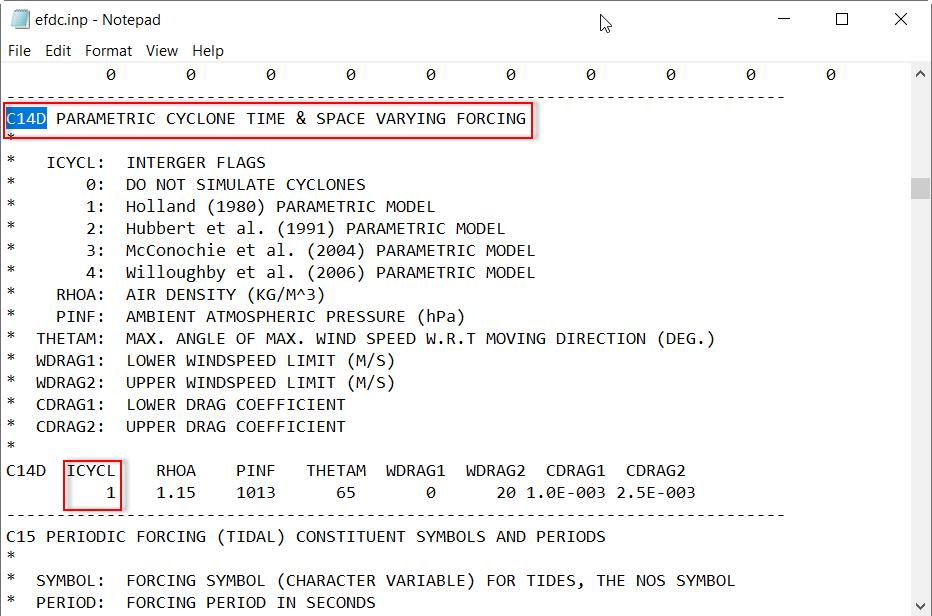
Figure 10. Cyclone Module activated in Card 14D in efdc.inp file.
Visualize Tropical Cyclones
The tropical cyclone track, pressure, and wind fields can be visualized and animated in 2DH View. These can be added to the 2DH View by clicking the Add button in the 2DH View’s Layer Control then select Primary Group: Wind as shown in Add the cyclone track and wind vector to the 2DH View by adding those layers under the Primary Group: Wind as shown in Figure 11.
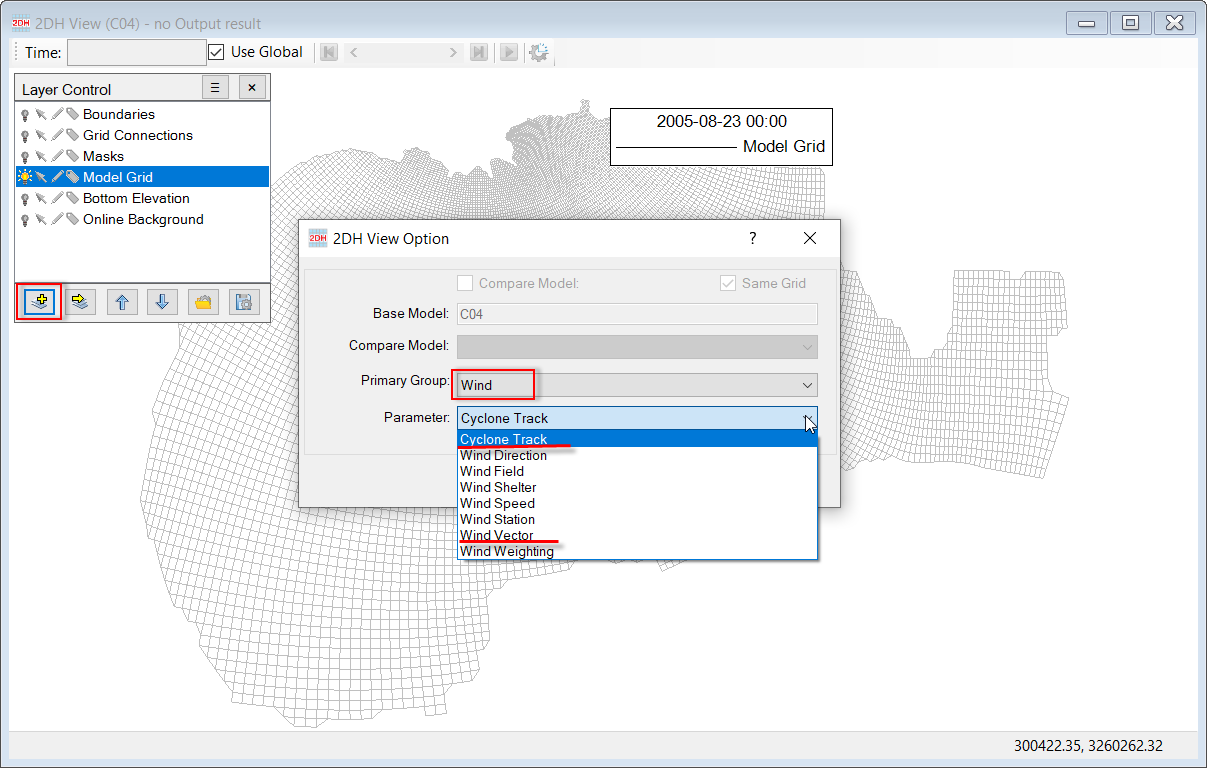
Figure 11. Add Cyclone Track and Wind Vector in 2DH View.
The pressure field and wind field of Hurricane Katrina are shown Figure 12 as an example. The cyclone is indicated by low pressure and strong wind circulation and the cyclone track is shown in black. The current cyclone center (also known as the cyclone eye) is marked with a red cross.
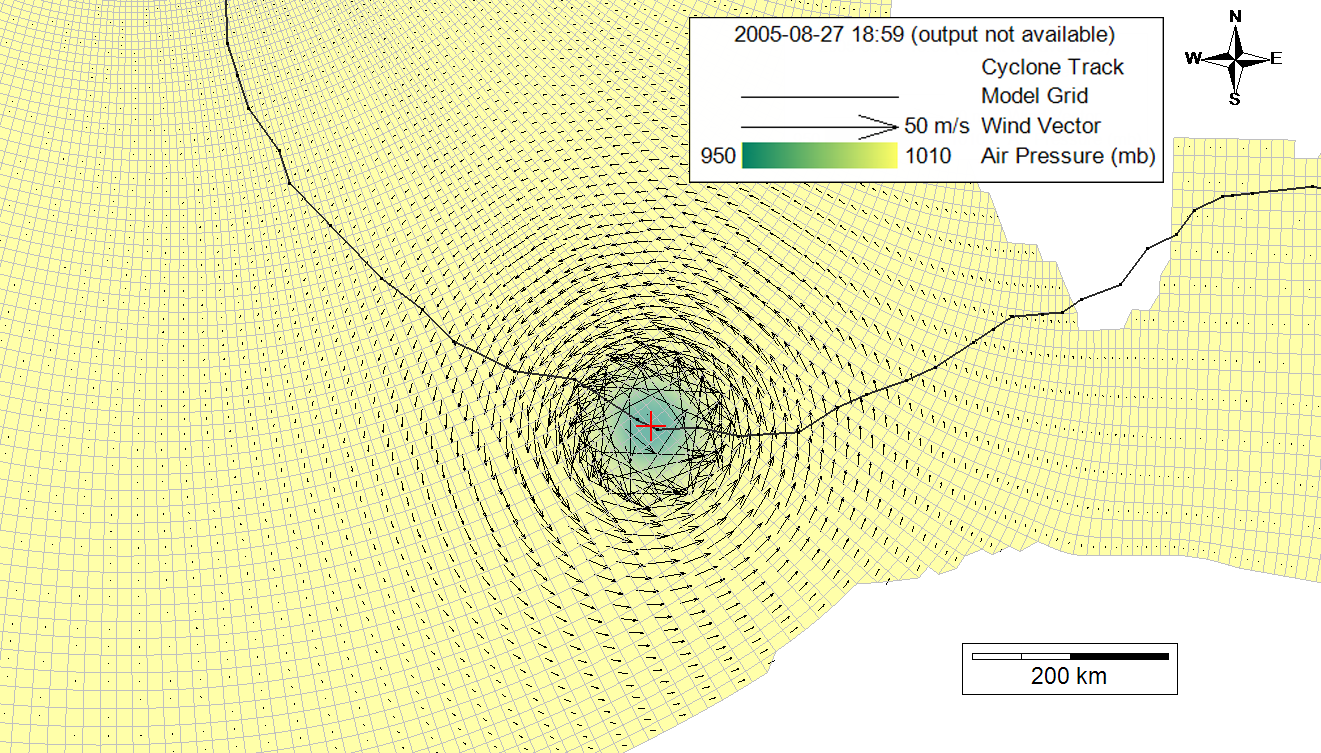
Figure 12. Air pressure and wind fields are shown with the cyclone track.