Auto generate data, plots, and statistics (EE12)
From the Model Control, go to the Model Analysis, In case the data stations have been defined to compare to the model output, the Auto Generate Data, Plots Statistics is enabled by RMC on each sub-tab of the Model Analysis. It means that it can be accessed for Calibration Time Series, High-Frequency Time Series, Vertical Profiles and so on, Figure 1 is an example for the Auto Generate Data, Plots Statistics option for Vertical Profiles.
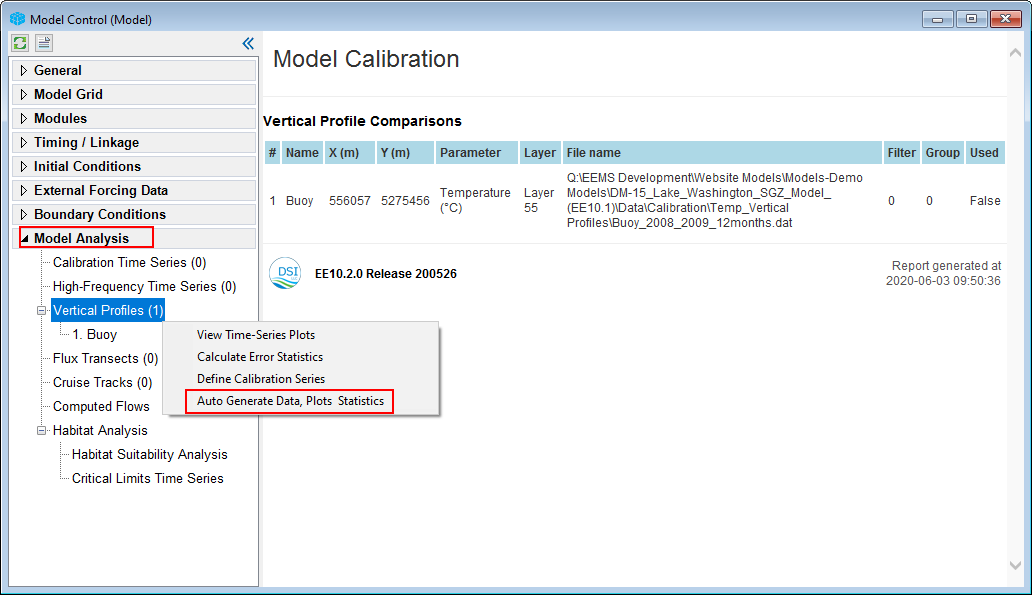
Figure 1: Vertical Profiles: Auto Generate Data, Plots Statistics option.
Right after the Auto Generate Data, Plots Statistics selected, the Auto Generate Options: Vertical Profiles form will be displayed as shown in Figure 2. There are two tabs in that form, including Calibration and Saved Plots.
Calibration tab
This tab has three frames, including Calibration Options, Generate Options, and Error Statistics Reporting. They are described below.
Calibration Options
There are several model calibration options, but not all options are enabled at the same time for auto generate data. It depends on the calibration type selected in the model analysis. For example, the Vertical Profiles option is selected to use the auto-generate option by RMC on the Vertical Profile sub-tab of the Model Analysis as shown in Figure 1. Therefore, Vertical Profile Plots option is available in the Calibration Option frame as shown in Figure 2.
Generate Options
- Reload Data & Model Result: extract model output after EFDC runs.
- Use Existing Model Extractions: Extracting the data from the EFDC output can be time-consuming if it is a large model run. To avoid having to extract the results each time, this option can be used to reuse the existing extracted data.
- Automatically Generate Defined Plots: if the box is checked, the comparison plot will be generated automatically. The plots will be stored in the #calib_plots folder as default settings. It can change the plot folder by clicking Change Folder.
- Automatically Export Model Series: the option is used to extract model output with the entire simulation time from the grid cell where the measured data station is located. The files extracted will be in the #calib_export folder as the default setting. It can change the plot folder by clicking Change Folder. In case the Pair Model and Data option is checked, the EE only extracts when the measured data is available for those time points.
- Export Image Type: it is able to save the image as *.emf, *.png, *.jpg, *.bmp, *.gif files.
Error Statistics Reporting
- Automatically Generate Reports: this option links to the Report Error Statistics frame below. If this option is not checked, the Report Error Statistics options are enabled.
- Set Error Statistics: Clicking this button, the Error Statistics form will pop up as shown in Figure 3. From this form, we can select the type of error statistics we want to export to a report by checking the boxes and then clicking the OK button. The Check All and Uncheck All buttons allow having a quick selection.
- HTM Report File or ASCII Report File: this option will set the format of the error report
- Change Folder: the error report is generated and saved in the #calib_stats folder as default settings. It can change the location of the error report by clicking Change Folder.
General button
- Generate: the button is used to generate the calibration plots and statistics of the calibration options
- OK: save the selection and close the Auto Generate Options form
- Cancel: This will skip selections and close the Auto Generate Options form
e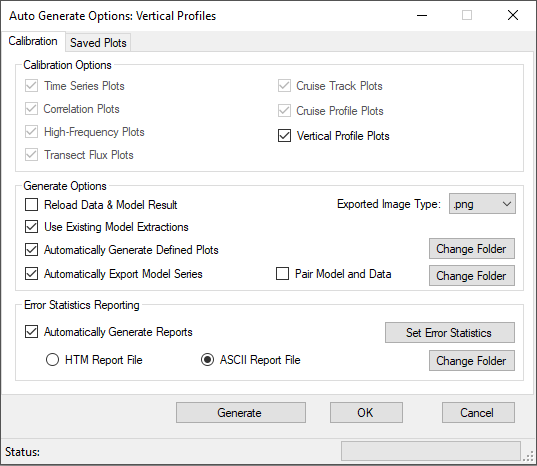
Figure 2: Auto Generate Options form.
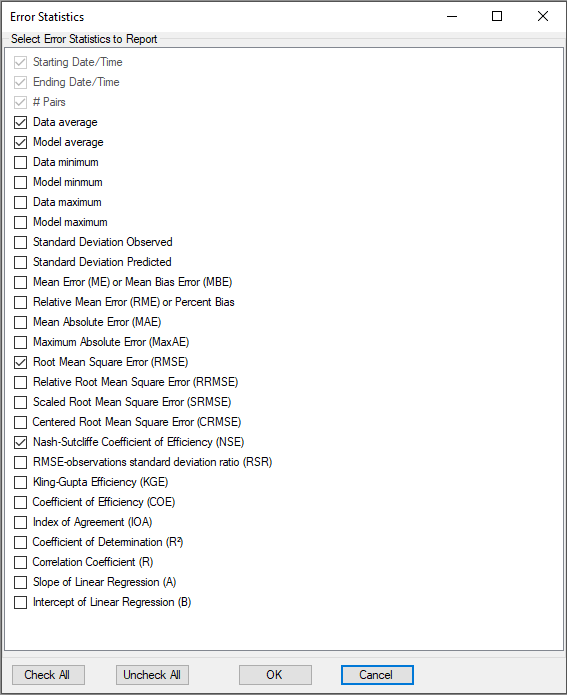
Figure 3. Select error statistics to report
Saved Plots tab
The tab of Saved Plots is used to export the 2DH, 3D, 2DV automatically, and longitudinal profile (LP) plots to image files *.png. (shown as Figure 4). Check on the Automatically Generate Saved Plots checkbox to enable this option.
- Define/Edit: when clicking this button the Saved Plots form will appear as shown in Figure 5. Firstly, it is necessary to define the Number of Saved Plots in the box. The Start and Stop day will be updated automatically based on the model timing. The Name column is used to define the title of the exported image. Path File is the location of the plot data. Time is the date of the plots. Check Use box to generate the plot. When check-boxes options are defined, finally click on the OK button to save the settings and close the form.
- Generate Plots: the plots will be generated automatically and saved to the *.png file in the #calib_plots folder as default settings.
When all check-boxes options are defined and selected, finally click on the Generate button (shown in Figure 4) to start generating data, plots, and error statistics. An informing message will be displayed to show where the plots and reports are saved as shown in Figure 6. Click OK to close the form.
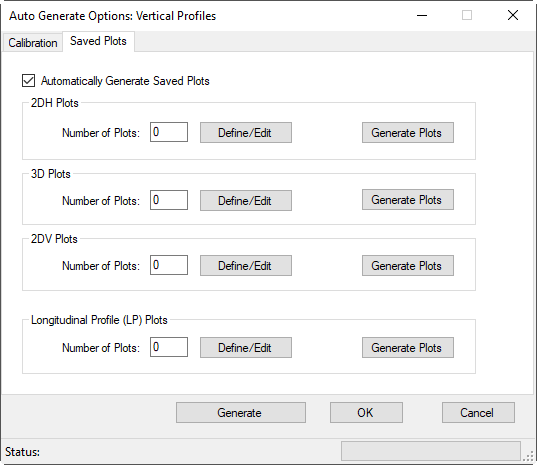
Figure 4. Saved Plots.
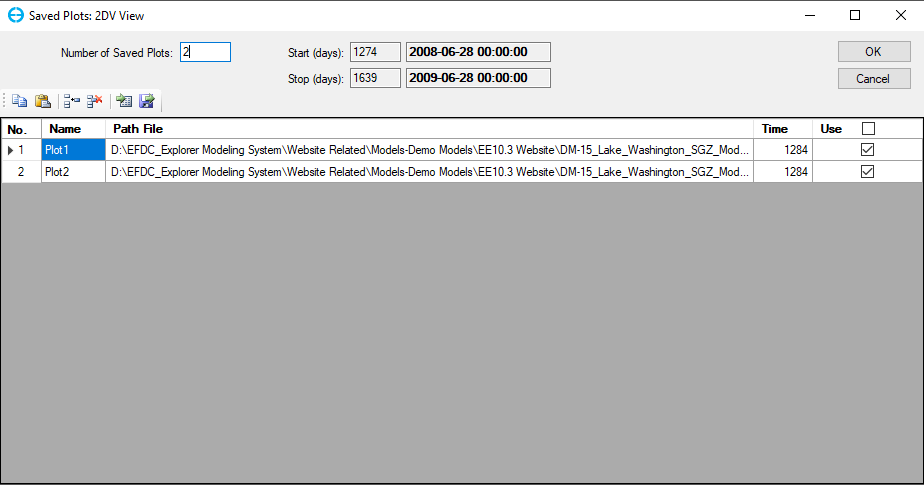
Figure 5. Define saved plots.
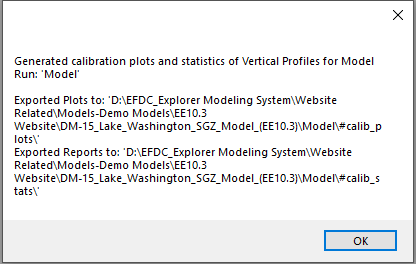
Figure 6. Informing message of plots and reports locations.