Velocity Rose
- Bui Bich Thuy (Deactivated)
- Duy Pham
- Kester Scandrett
The velocity rose features (available from EEMS11.2) allows the user to display the speed and direction distribution of a given cell over a user-defined period of time.
This feature is available from the 2DH View, from which a velocity layer must be added, and the active mode turned on as presented in Figure 1. The user is then able to select a location of interest, and the information of the selected cell will be presented in a yellow box.
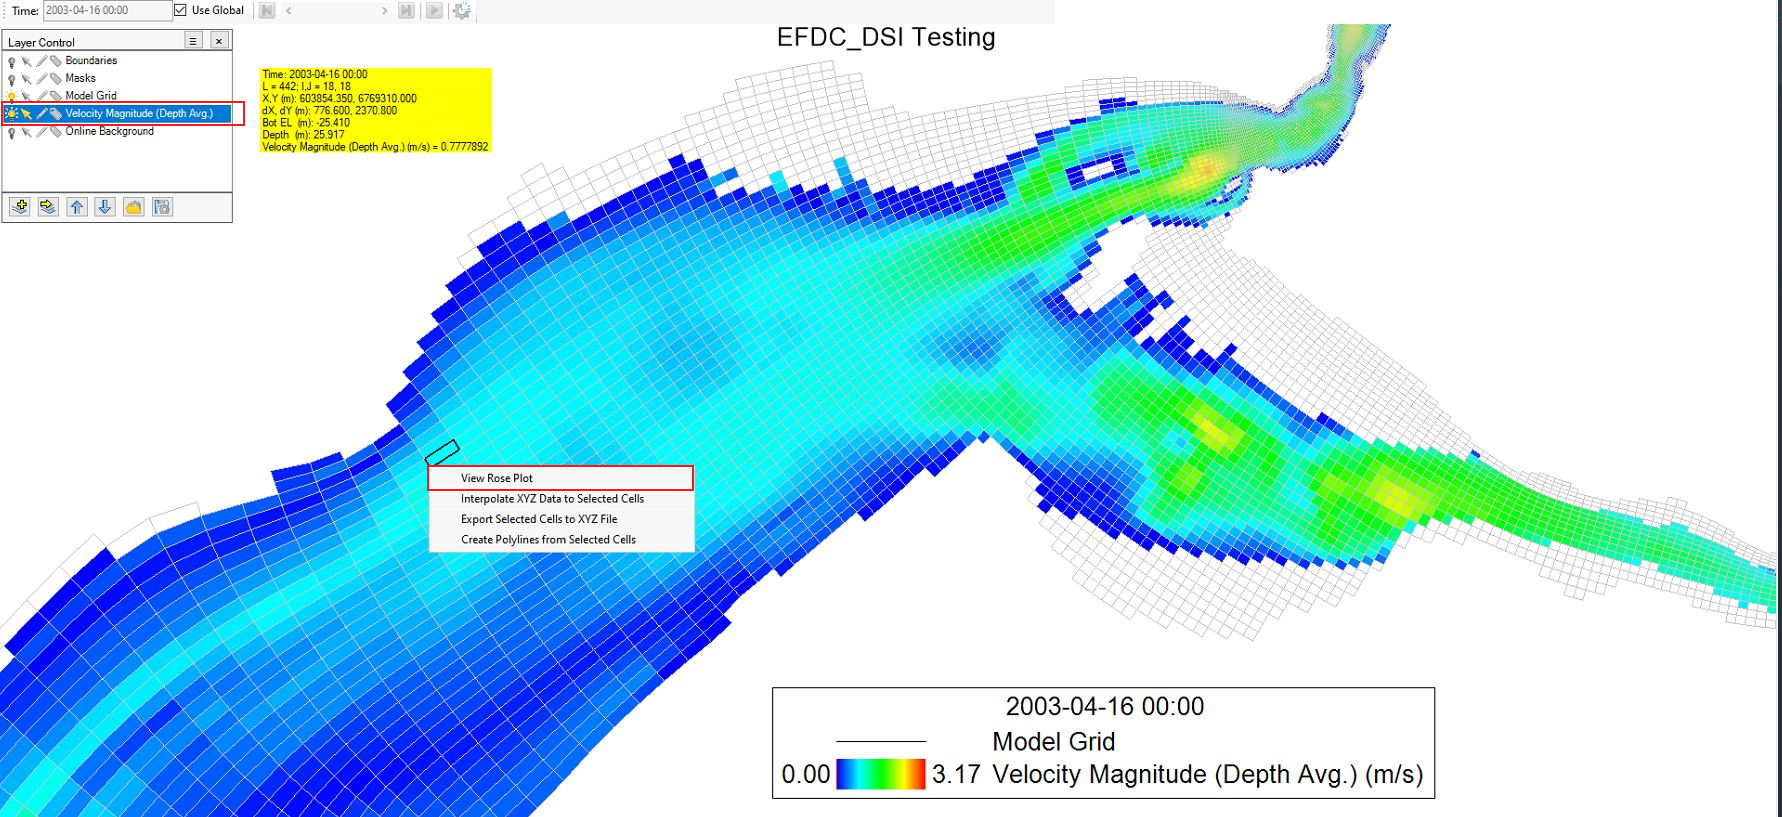
Figure 1. The Velocity layer.
RMC on the selected cell and click View Rose Plot (as shown in Figure 1). Use the form shown in Figure 2 to select the times to plot within the range of the whole model time (provided at the top of the form) and then click OK to process the plot. Please note that the time format is presented in Julian date format.
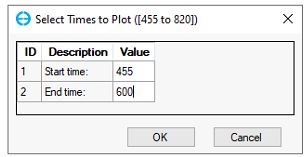
Figure 2. Select Times to Plot.
The velocity rose of the select cell is presented in Figure 3. The location of the cell being displayed and the time period are shown at the top of the plot. The velocity rose can be attached to the 2DH view or can be floating as a separate window.
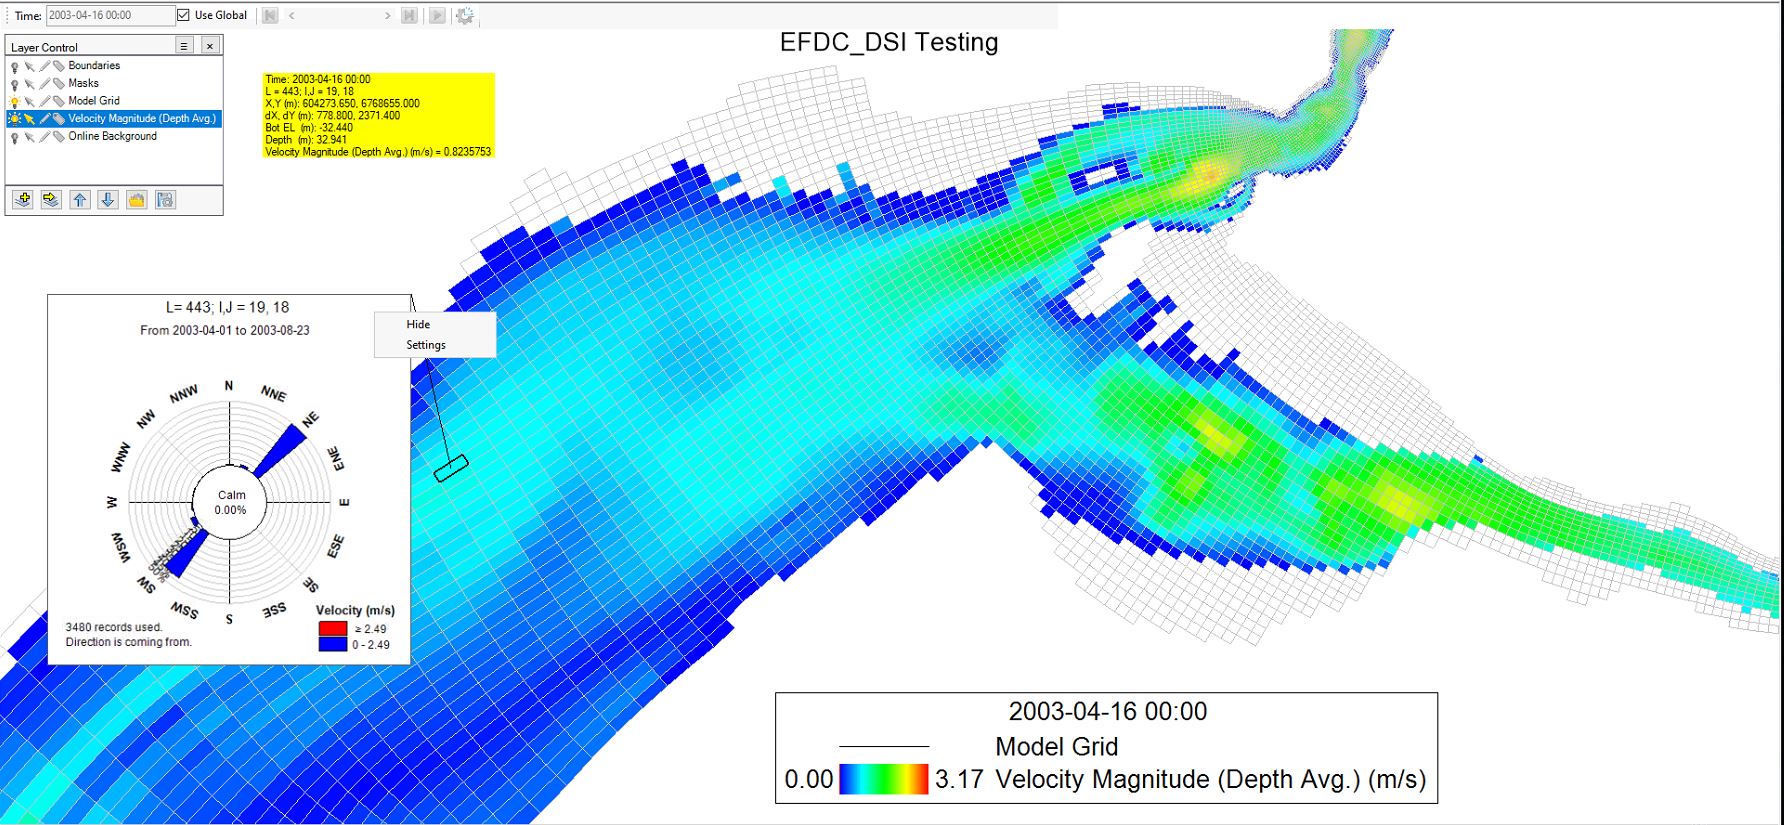
Figure 3. Velocity Rose of a selected cell.
RMC on the plot of velocity rose and select Settings (shown in Figure 3). The Rose Plot Utility provides options for editing the labels, setting the scale, and adjusting the sectors. The user may also save the defined rose plot format and reload it at a later time or to apply the same formatting style on another cell, using the Save and Load options (Figure 4). In addition, it is also possible to export the rose plot as a bitmap and Windows metafile image.
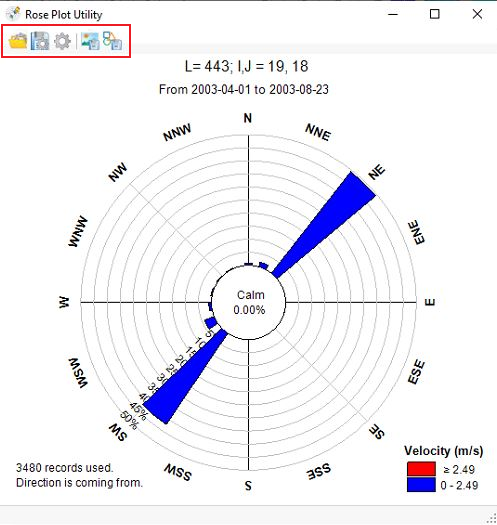
Figure 4. Settings of the rose plot.
Multiple velocity roses may be displayed by selecting multiple cells in 2DH View as shown in Figure 5 . In the main toolbar, the user can check the Rose Frames option to display a list of rose plots with detailed information about the location and time period.
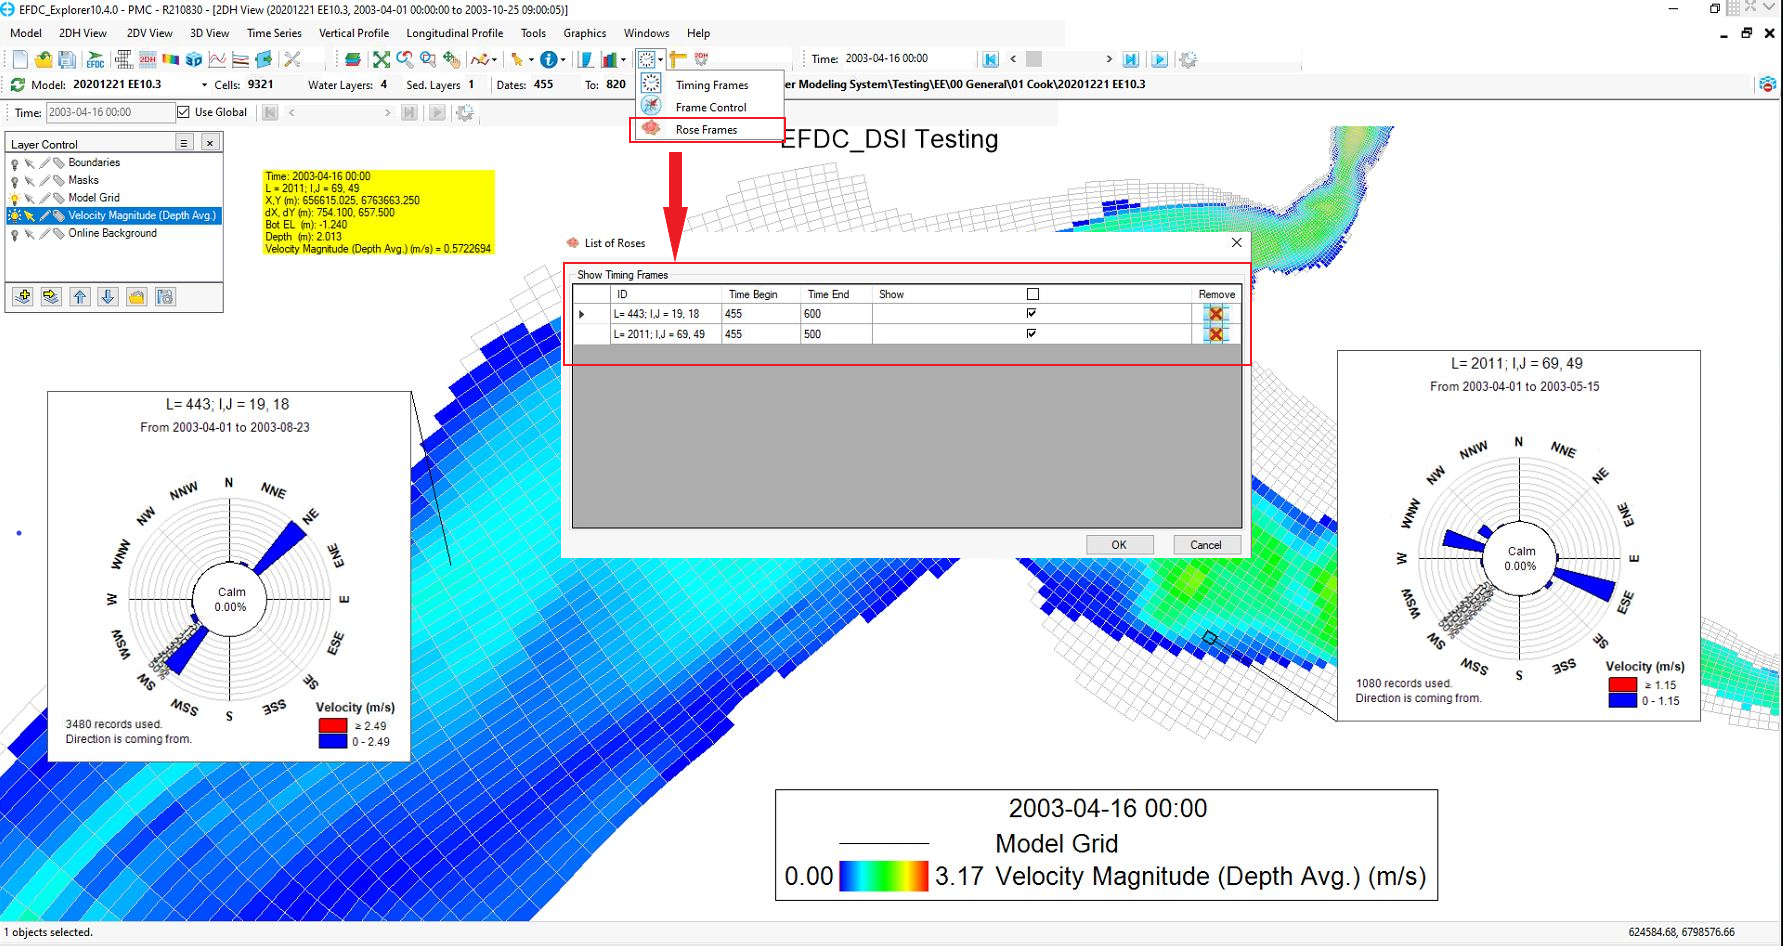
Figure 5. Multiple Velocity Rose Plots.