/
Orthogonal Deviation
Orthogonal Deviation
- Kester Scandrett
- Duy Pham
Owned by Kester Scandrett
This option displays the orthogonal deviation of the grid. Each cell is colored based on its orthogonality and a legend is displayed showing the scale as shown in Figure 1.
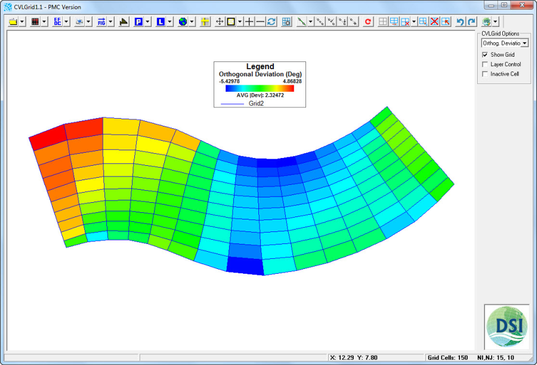
Figure 1 "Orthogonal Deviation" viewing option.