Annotations Tab
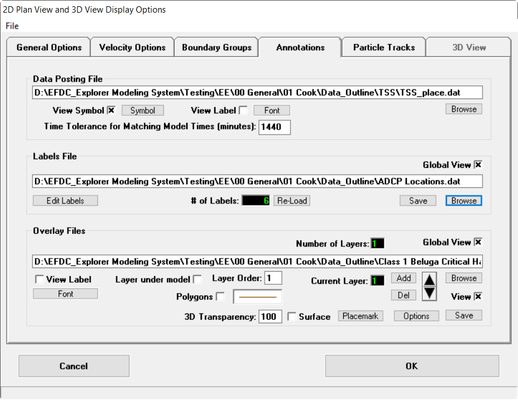
The main user labeling and overlays are controlled in the fourth tab of the Display Options form (Figure 1). The first two main options are Date Posting Files and Labels Files. A labels file and a data posting file use essentially the same format (X Y Label). The main difference is that the labels in the labels file can be individually formatted while those in the data posting file all use a single format. For labels, EFDC_Explorer uses a file with the same name as the file with the labels but has a second file with a .LBF extension to save the individual label formats.
Google Maps © standard .KML files may also be imported as a data posting or labels file.
When calibration data in the Time Series (Time Series Graphing) or ViewSlice (ViewSlice) has been configured the user can use the View Calibration Data (View Calibration Data) toolbar function to display calibration information on selected plots. The symbols, fonts and time tolerance in the Data Posting File frame control the display format of the calibration data.
The Global View checkboxes allow the user to turn on or off the entire corresponding feature. For both labels and overlays, individual items can be turned on or off also.
The Overlay Files frame is where the user assigns the polygon and polyline files that may be overlaid or underlaid on the model domain in ViewPlan. The Layer under model checkbox tells EFDC_Explorer to plot the specified layer first and overlay model results on this. A series of different overlay files may be assigned and configured individually by scrolling through the Current Layer with the up and down arrow keys. The user may also set the Layer Order with priority assigned with a numeral.
To change the display format of an overlay line, LMC on the line display. The Polygons check box will display the XY data as closed polygons.
View3D options related to 3D Transparency are described under Import Structures in View3D.
Figure 1 ViewPlan Display Options: Annotations.
