The table below is an example for harmonic constituents for Trakhuc estuary.
| Name | Speed(deg/hr) | Amplitude (m) | Phase (s) |
|---|---|---|---|
| Q1 | 13.3987 | 0.04 | 126.073 |
| O1 | 13.943 | 0.261 | 146.432 |
| P1 | 14.9589 | 0.097 | 182.577 |
| K1 | 15.0411 | 0.293 | 185.991 |
| N2 | 28.4397 | 0.04 | 59.376 |
| M2 | 28.9841 | 0.185 | 75.861 |
| S2 | 30 | 0.072 | 114.865 |
| K2 | 30.0821 | 0.025 | 95.187 |
STEPS FOR ADDING INPUT HARMONIC CONSTITUENTS TABLE
- Click to the E button
 which is next to Harmonics (See Figure 1)
 - Enter the Number of Series, which is 1 for this case (see Figure 2)
- Enter the Title of Series, as "Tides"
- Enter the Number of Harmonic Constituents to Use, in the case there are 8.
- Copy the tidal constituent values from above table into the form.
- You may want to click View button in the Figure 2 to see the tidal timeseries plot as shown in Figure 3
- Click Close and Return to exit the plot
- Click OK button in the Figure 2 to finish.
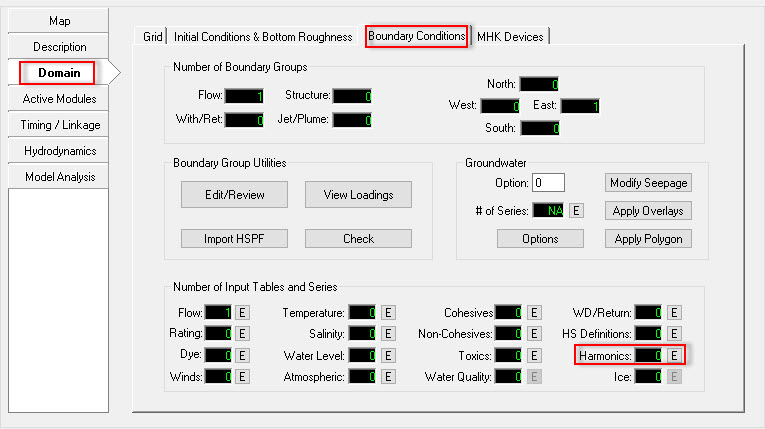
Figure 1 Assigning tidal boundary conditions.
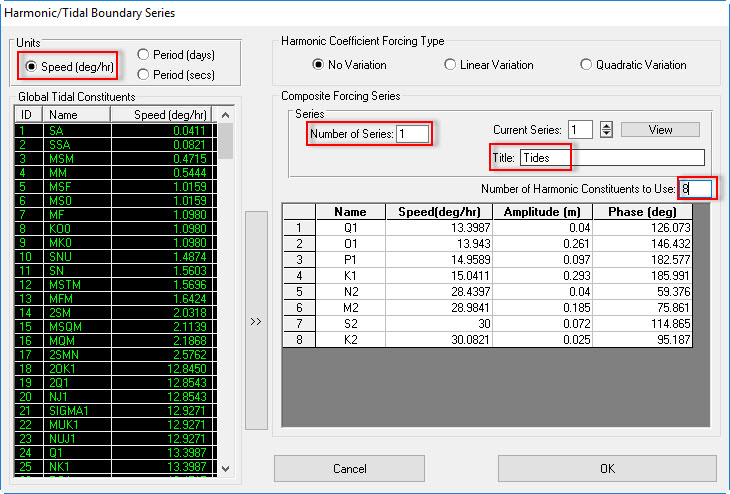
Figure 2 Preparing the harmonic and tidal boundary series.
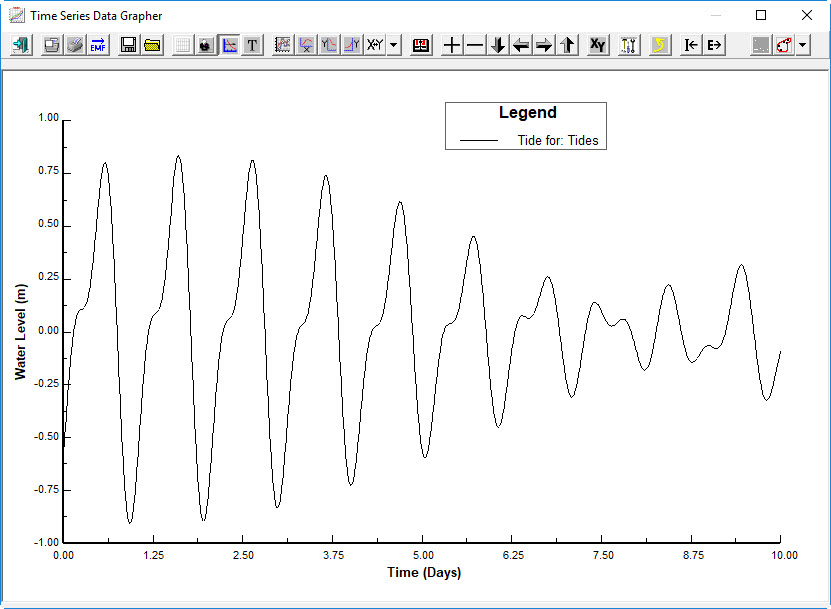
Figure 3 Tides Series Plot.