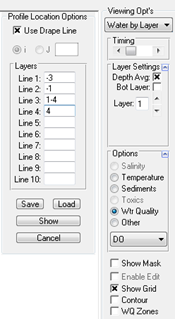
When viewing the water column in many of the ViewPlan | Viewing Options the drop-down the Longitudinal Profile tool is available on the toolbar (the button is greyed when not available). This function is similar to the 2D profile ViewProfile but provides an XY longitudinal plot of the current parameter along some profile. The approach to define the data extraction location is identical to the 2D Slice/Extraction Options used by ViewProfile (see Slice/Profile Selection). If a Use Drape Line is selected the user should define the layers required, and after selecting the Show button will be prompted for the drape line.
Up to ten lines are allowed per plot. The water column data selected is the main parameter to be plotted. However, the layering options are controlled by the Longitudinal Profile tool, not the settings in the Layer Settings frame. There are some special cases available for display. The following list provides the options available for each line.
...
...
Layer # A specific layer number or a range of layers to average. In the adjacent graphic the "Line 4" field has "1-4" entered. Therefore for that line DO being plotted is the average DO for those layers.
0 If a "0" is entered then the value extracted will be the depth averaged value.
...
| Anchor | ||||
|---|---|---|---|---|
|
Figure 7 30 ViewPlan: Profile Plots Timing Frame Options.
...

