Velocity Magnitude by Color in ViewSlice
EE can display the velocity magnitude in the ViewSlice screen in much the same way as it does in the ViewPlan screen. This may be seen in Figure 1 below where arrows indicate direction of flow and the color.
Note that the user may go to any date with the Go to Date function (Ctrl-G) and scroll along the i or j axis with "+" and "-"keys on the keyboard.
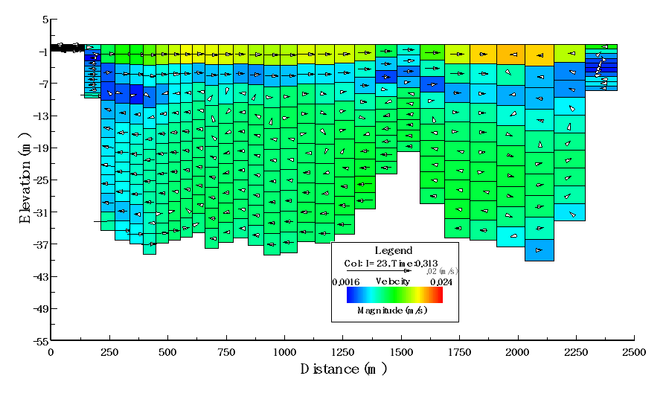
Figure 1 ViewSlice: Velocity color by magnitude.