The ViewPlan toolbar provides access to a range of different functions and utilities (Figure 7-5). Some of these functions are dependent on the current context while some are not. Table 7.3 contains a summary of each function.
Figure 7 5 ViewPlan Toolbar.
Table 7 3 Summary of ViewPlan toolbar.
|
Exit ViewPlan. |
General |
|
Printer setup options. |
|
|
Print to current printer the current view. |
|
|
Export the current view to a Windows enhanced metafile (.EMF) or as a Bitmap (.JPG) |
|
|
Export the current major option to Tecplot, KML, Shapefile or to SWAN |
|
|
Create a new EFDC model using the current time to assign the IC's. |
|
|
Julian date Gregorian calendar calculator. |
|
|
Display options for color ramp, vectors, grid lines, overlays, etc. |
Display |
|
Toggles the display dereferenced bitmap backgrounds. |
|
|
Zoom extents. |
Navigation |
|
Zoom in at fixed increments. |
|
|
Zoom out at fixed increments. |
|
|
Pan Left. |
|
|
Pan Right. |
|
|
Pan Up. |
|
|
Pan Down. |
|
|
Distance tool. Distances are displayed in the status bar. |
|
|
Time series tool. Point and click on cells to build a group of cells. |
Post-Processing |
|
Vertical profile tool. Available in Water Column option of ViewProfile. |
|
|
General statistics tool. Results are copied into the clipboard. |
|
|
Longitudinal profile tool. |
|
|
Water and Mass flux (see below for details) |
|
|
Animation tool. Output animations to the screen and/or AVI files. |
|
|
Polyline/polygon creation/edit tool (see below for details). |
|
|
Model Results Extraction Tool - a point & click data extraction tool. |
|
|
Multi-cell selection tool for general purpose editing using Modify Cell form. |
Pre-Pro |
|
Copy cell property button. A rapid point & click method of cell by cell adjustments using operators. |
|
|
View calibration stations, data and/or Model-Data residuals. |
Post-Pro |
Printer Setup
The current default printer is automatically used by EFDC_Explorer. Figure 7 6 shows an example printer setup form that appears when the highlighted toolbar button is clicked. If no printers are available during the startup of EFDC_Explorer, it will display a warning but will continue. Besides being used for printing, the settings from this form also impact certain exported graphics. The primary setting used is the portrait versus landscape option to set page orientation.
Figure 7 6 Printer Setup.
Export EMF and Bitmap Files
As most of the modeling efforts end up in engineering and scientific reports, it is very important for EFDC_Explorer to have the ability to produce high quality graphics that can go directly into all of the most popular word processing packages. The ability to export enhanced metafiles (EMF's) meets this need. EMF's are a native Windows based graphic that easily imports into almost all word processing and presentation packages.
The size and shape of the metafile depends on two things in EFDC_Explorer. If you are exporting the results using the Show Border check box, then the size and shape will reflect the printer settings. If the check box is not displayed then the size and shape will reflect the current ViewPlan window.
Another useful format for images for reports and presentations is bitmap (.BMP). EFDC_Explorer has the ability to export bitmaps at user defined resolutions as shown in Figure 7 7. Here the user may set the resolution in dots per inch and the size of the bitmap in pixels in the X and Y directions.
Figure 7 7 Export EMF file as Bitmap.
Export Tecplot, KML, Shapefile Files
It is recognized that EFDC_Explorer does not and will never handle all the post-processing desires/needs of every project. Therefore, the capability to export the data to third party packages via an ASCII file is provided by the inclusion of the TP function from the toolbar whereby the user may export Tecplot® files. When selected, ViewPlan displays the form shown in Figure 7 8. Here the user can select the beginning and ending times to export as well as the skip interval. From EE7.3 users can export the water column parameters in addition to bed parameters directly to Tecplot. The Tecplot export function in Water By Layer and Water By Depth option has also been implemented. When exporting the sediment bed toxics EE exports the real values and does not truncate the output.
The user must select the times to be exported. The user may manually select the times using the Windows standard LMC, Ctrl-LMC and Shift-LMC to select one or more times. Another time selection option is to press Select All (the button then toggles to Select None) and set the Output Interval. An Output Interval of 1 will output all selected times, a value of 2 will output every other snapshot, etc. The number of snapshots that will be exported is shown in the # Selected box.
The Horizontal Skip is used to set a skip count for exporting the model cells. A skip count of 1 means every cell will be exported.
Figure 7 8 Tecplot export timing options.
Also on the ViewPlan | DAT button drop down menu is the ability the export KML (Keyhole Markup Language) files. KML are native Google Earth© files, using a type of XML language used for expressing geographic annotation and visualization within web based, 2-D and 3-D maps. After selecting this option and entering a file name the user is prompted for the UTM Time Zone (1 to 60) and Opacity (%). After creating a KML the file may be loaded into Google Earth© where each I,J cell is displayed as a place (see Figure 7 9).
Figure 7 9 KML file exported from EFDC_Explorer to Google Earth©.
As of release of EE7.2 there is an option to export whichever Viewing Option is selected in ESRI © shapefile format. In addition to the shapefile, the projection file is also provided and the sample shapefile loaded in ArcGIS is shown in Figure 7 10.
Figure 7 10 Shapefile showing Salinity viewed in ArcView.
Export NetCDF Files
From the release of EE7 it is possible to export model output in NetCDF format. NetCDF (Network Common Data Form) is a community standard for sharing scientific data. Developed by Unidata, it is a set of software libraries and machine-independent data formats that support the creation, access, and sharing of array-oriented scientific data.
EE uses the CF (Climate and Forecast) conventions which Unidata describes as "designed to promote the processing and sharing of files created with the NetCDF API. The CF conventions are increasingly gaining acceptance and have been adopted by a number of projects and groups as a primary standard. The conventions define metadata that provide a definitive description of what the data in each variable represents, and the spatial and temporal properties of the data. This enables users of data from different sources to decide which quantities are comparable, and facilitates building applications with powerful extraction, re-gridding, and display capabilities." http://www.unidata.ucar.edu/software/netcdf/
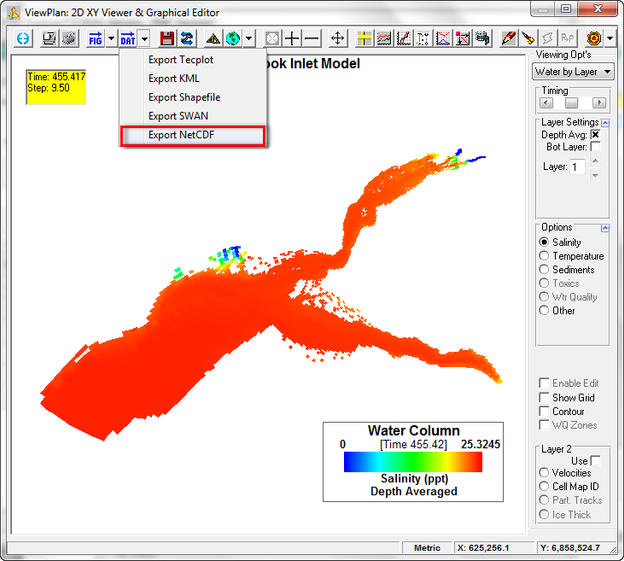
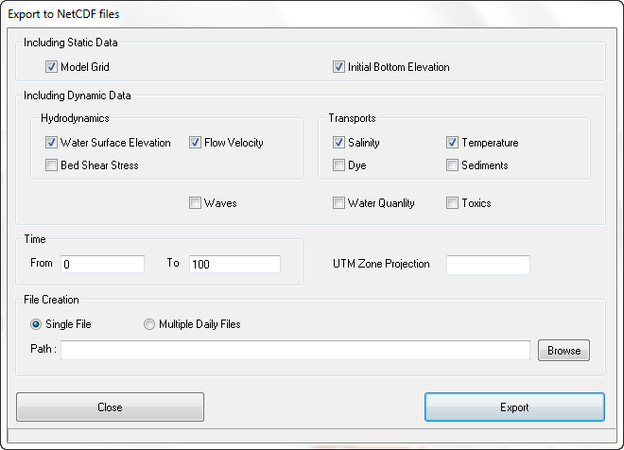
Figure 7 11 shows the dropdown menu for exporting data from ViewPlan. When the user selects the Export NetCDF option then form shown in Figure 7 12 is displayed.
Figure 7 11 ViewPlan: Export NetCDF Option.
Here the user may select which data is to be exported. The Export to NetCDF files form allows the user to select static data such as the model grid and initial bottom elevations to be exported. Dynamic data from hydrodynamics and constituent transport may also be exported. The user should select the begin and end time for the export of the data.
In the File Creation frame the user may select from exporting all the NetCDF data in one file, or separate it into a series of files, one for each day.
Figure 7 12 Export NetCDF Files Options.
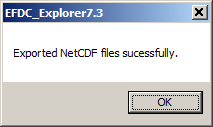
Figure 7 13 NetCDF Files Exported
Create New EFDC Model
This function saves to disk a new project using the model results at the time of current view (as indicated in the legend) as the initial conditions. When selected the user is prompted to select a new project directory to save the new model to. All appropriate flags and settings are adjusted in the current model to allow the user to load the newly saved model (the original model is still the current project) and run EFDC. All parameters being simulated use a spatially variable initial conditions file.
This feature is useful for testing various adjustments or corrections to the model inputs after a particular date. An example would be to test why a model crashed after a certain time by adjusting boundary or wetting//drying options and running a "continuation" model. If appropriate, the model results from a continuation model can be merged with the original model to produce a single model output for plotting and analysis. See Section 5.5.5 for more detail.
Polyline/Polygon Creation Tool
EE makes extensive use of polygons when applying cell properties and the Polygon Tool is the primary utility in EFDC_Explorer to create and edit the various polylines and polygons that the user may need to help define boundary cells, flux lines, model annotation, velocity profiles, etc. . In these cases, cells that are inside the polygon(s), using the Inside Cell Test options, are adjusted according to the options specified in the Modify Options frame. When the toolbar button is pressed, EFDC_Explorer asks the user for a file to load in order to edit existing data. The user can either select the file to edit or press cancel to start with no existing lines.
From the release of EE7.2 this tool is greatly simplified and provides the user with separate toolbar on the workspace. The Polyline button is shown in Figure 7 14 using a small red rectangle on the top menu. When selected, it provides the user with a number of options for creating and editing polylines and polygons which are described in Table 7 4. Note that LMC commences a new line and RMC ends the line. After RMC the user must select an ID String for the polyline (Figure 7 14). However, it is important to note that entering a value here does not save the polyline and if left blank will delete the polyline. A .P2D file may contain multiple polylines each with different ID strings. After entering the ID the user must select the Save button for the polyline/s to be actually saved for later use. Though the default format is P2D, DX files can also be written by explicitly specifying the file extension as DX.
When the polygon/polyline editing tool is active many of the other standard mouse operations are disabled.
Figure 7 14 ViewPlan: Polygon Tool.
Table 7 4 Polyline Tool Buttons.
|
Open an existing polyline for editing. |
|
Save a polyline. It is necessary to select this icon for the polyline to saved. |
|
Draw a new line. LMC in the workspace creates a point. Moving the mouse and LMC in another location creates another point with a line joining the two points. RMC to end drawing the polyline. |
|
Delete previously created line. When this icon is selected, clicking on a line will delete it. |
|
Insert points on an already created line. Once a point is inserted it can be moved to reshape the line. |
|
Move points on a polyline. |
|
Delete points on a polyline. |
|
Close the current polyline to create a polygon |
|
Open the current polygon to make a polyline. |
|
Help for using polyline tool |
Water and Mass flux
This tool is used to calculate the water and mass flux for WQ parameters such as salinity or DO and is most useful when wanting to compute pollutant loadings
To use this tool the user must first have a flux line, or create a flux line with the polyline tool in ViewPlan. The user should then select the Water and Mass flux button and select polyline over which the flux is to be calculated as shown in Figure 7 15. From this dialog box the user may also select from various flow options, including total flow, the I,J direction for which flux will be calculated, or the dominant flow.
Figure 7 15 Flux calculation options.
EFDC_Explorer will then calculate a time series showing the flow, mass flux (g/s) and average concentration. If the user switches off time series check box then a table of EW and NS total and absolute fluxes is reported for the mass flux past that line for the time period specified.
View Calibration Data
When calibration data in the Time Series (Sect. 6.1.2) or Vertical Profile (Sect. 6.1.4) has been configured the user can use the View Calibration Data function to display calibration information on selected plots. The symbols, fonts and time tolerance use the data posting options in the Display Options form (Sect. 7.3). The data components of this function only apply to the Water Column view. When viewing the water column results EFDC_Explorer matches the viewing parameter to the data parameter. If there is no data currently configured data for the current viewing parameter a message will be displayed
The View Calibration Data toolbar function toggles on and off the display of the following:
Show Data Stations: Label the current plot with Station IDs. This information will be displayed on most views even if there is no matching parameter in the calibration data.
Show Data Values: Labels the current plot with calibration data if there is a parameter match to the data and the data is within the tolerance time of the current view.
Show Data Residuals: Labels the current plot with residual (Model – Data) if there is a parameter match to the data and the data is within the tolerance time of the current view.
Use Layer Options/Show All Layers: This option enforces the calibration data layer options to the current view. If not checked the data and residuals displayed will be based on depth averages.
Set Model/Data Time Tolerance: Allows the user to set the number of minutes allowed between the model snapshot time and the data time. If the absolute time differences are less than or equal then EFDC_Explorer will consider the two time the same and display the appropriate data or residuals.
Show Previous Data: This function jumps the current view backwards in time to the previous model-data match for the current parameter. If a match is not found, or the current model time is less than the first data record, a message will be displayed in the status bar indicating that there was no match. Ctrl-< keystroke performs the same function.
Show Next Data: This function jumps the current view up to the next model-data match for the current parameter. If a match is not found, or the current model time is greater than the last data record, a message will be displayed in the status bar indicating that there was no match. Ctrl-> keystroke performs the same function.
Model Results Extraction Tool - Export XY data file as I,J
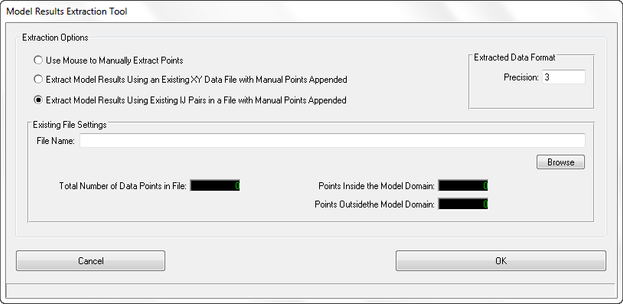
The Model Results Extraction Tool (for extraction of x, y and current value using the mouse or pointer) in ViewPlan has been updated from release of EE7.2 with a function to extract/load model results as I,J. Previously EE only allowed exporting as X,Y points. The new GUI is shown in Figure 7 16.
Figure 7 16 Extraction Data Tool.


