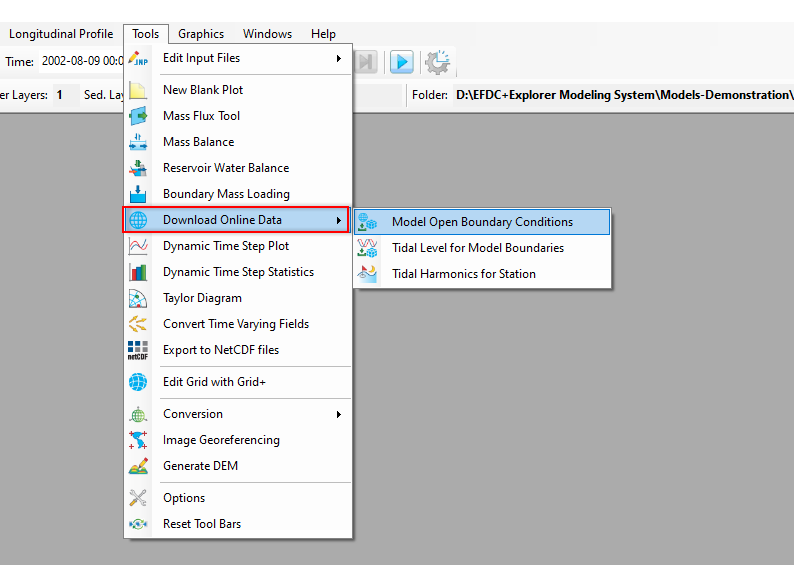
We can access this feature from the Tools menu, select Download Online Data. Then there are three sub-options Model Open Boundary Conditions, Tidal Level for Model Boundaries, and Tidal Harmonics for Station as shown in Download Online Data (new).
Figure 1. Options of Download Online Data.
Model Open Boundary Conditions
This feature allows getting online data for the existing open boundary of the model. The available data from online source can be the following data types:
- Water surface elevation
- Water salinity
- Water temperature
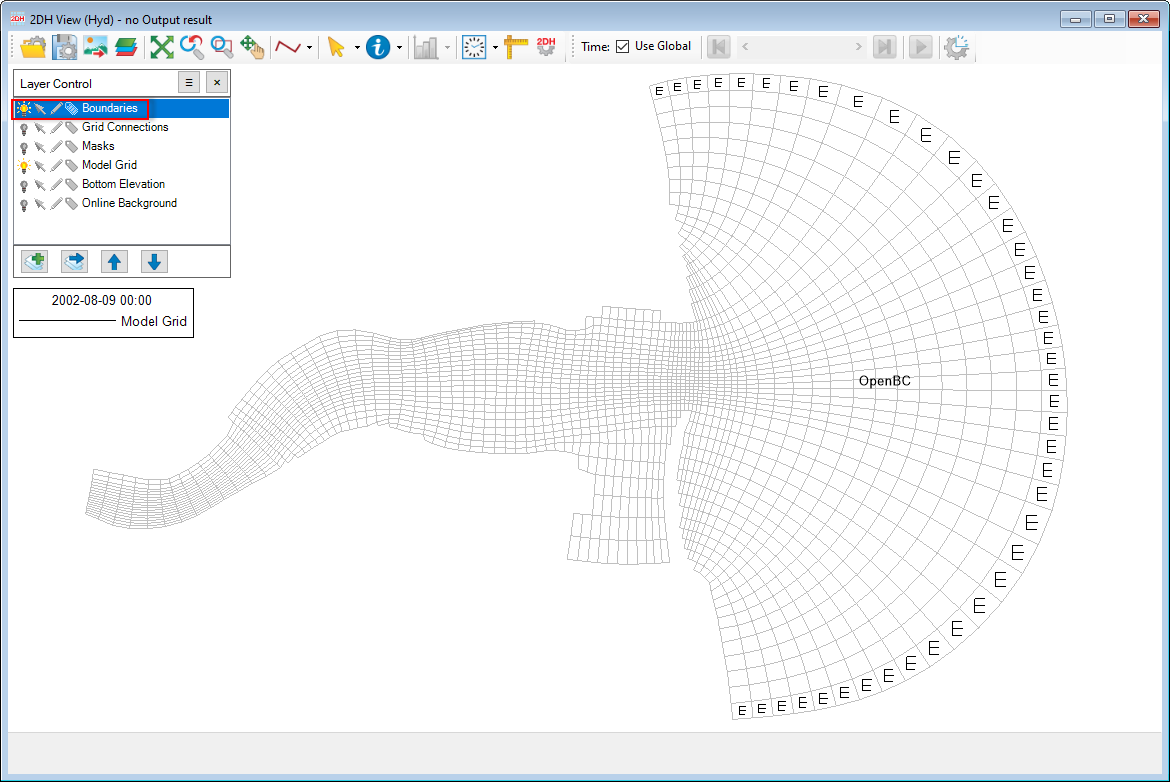
Suppose that we have a model with an existing open boundary. Open the 2DH View, turn on the light in the Boundaries layer of the Layer Control to show the boundaries of the model as shown in Download Online Data (new). The purpose of this is to view where is the open boundary.
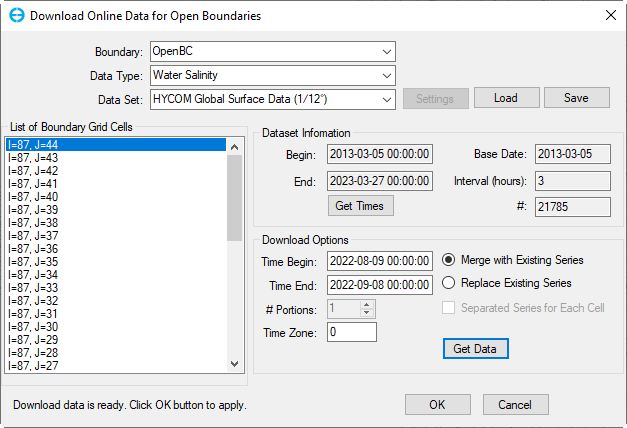
Next, go to Tools menu, then select Download Online Data / Model Open Boundary Conditions, the form of Download Online Data for Open Boundaries will be displayed as Download Online Data (new).
Figure 2. Show Boundaries.
Figure 3. Download Online Data for Open Boundaries form.
Boundary
Data Type
Data Set
List of Boundary Grid Cells
Dataset Information
Begin
End
Get Times
Base Date
Interval (hours)
#
Download Options
Time Begin
Time End
Merge with ExistingSeries
Replace Existing Series
Seperated Series for Each Cell
Get Data
OK
Cancel
Figure 4. Flow Boundary Mass Loading: Report.
Tidal Level for Model Boundaries
Tidal Harmonics for Station
Online Tidal Harmonics: This tool can be treated as a shortcut or an alternative method to generate a tidal water level series. The user must specify the simulation period beforehand so EE can generate data series for this period. To generate water level data series for model boundary cells, the user can bring up a 2DH view and then select a range of boundary cells for which water level data series will be generated (Figure 6). When the boundary cells have been selected, the user can select from the main menu Tools and the sub-menu Online Tidal Harmonics then Download for Model Boundaries (Figure 7). The download dialog will show up with the position of the selected cells populated in the List of Locations in Figure 8. The user can manage the list of the selected locations using Add, Remove and Update buttons. The phase lag of the harmonic constants is referred to as zero UTC so the user may need to change the time shift to adjust for the model local time. Once everything is ready, the user can click the Get Data button to download the harmonics and generate the data series. The generated water level data series will be populated to the Water Level group in External Forcing Data and can be used for the model boundary conditions.


