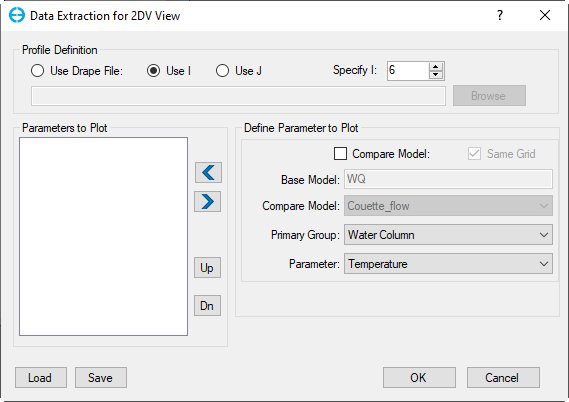
The form of Data Extraction assists to define the location of the profile and the parameters to be displayed in 2DV View ( shown in Data Extraction (new)).
Figure 1. Data Extraction from 2DV View.
Profile Definition
The Profile Definition frame needs to be set before a profile can be extracted from EFDC. There are three options shown in Data Extraction (new). It is possible to select a value of I to extract the active J cells along that I, or select a value of J to extract the active I cells along that J. The third option is to use a "Drape Line", which is a polyline in the same coordinate system as the LX, LY data. The I & J's along this line will be assembled and the profile will be output along with that slice. If an I or J extraction is used, the user can scroll up and down the select a coordinate.
Define Parameter to Plot
The Define Parameter to Plot frame requires to select which parameters will be displayed. First, it is necessary to select the Primary Group, then select the Parameter from that group is available to choose. It is required to click the left arrow button to confirm the selection. It is possible to select more than one parameter for the plot.
The version of EEMS11.3 supports a new function to view the parameters of EFDC arrays in 2DV. When selecting the primary group as EFDC Arrays and then the drop-down list of parameters are available as shown in Data Extraction (new).
Figure 2. EFDC Arrays Parameters.
| Parameter | Description | Unit |
|---|---|---|
| DZC | Vertical layer thickness as decimal fraction of water depth dimensionless | unitless |
| Turbulent intensity | L*L/T*T | |
| DML | Turbulence dimensionless length | unitless |
| LENGHT | Turbulence length scale | meters |
| AV | Vertical Eddy viscosity | L*L/T |
| AB | Vertical Eddy diffusivity | L*L/T |
Parameters to Plot
The parameters selected are displayed in the Parameters to Plot frame. The parameters can be added or removed by clicking left and right arrow. The Up and Down buttons will change the order of the parameter in the displayed plot. The user is able to save the current 2DV layout by clicking the Save button or load an external 2DV layout by selecting the Load button.
Figure 3. Plot buttons.
Update
The Update button will replace the currently highlighted parameters in the Parameters to Plot frame with the currently selected parameters in Define Parameter to Plot frame.
Properties
The Properties button will open the 2DV View Properties form where the user can configure the color ramp, contour, precision, range, and other settings (Data Extraction (new)).
Figure 4. 2DV Properties.
Click OK to plot 2DV View.
Figure 5. AV parameter in 2DV.


