A common function needed for all the boundary forcing data series is the need to add, edit, view and compare time series for forcings. Following is a summary of the processes and other time series utilities in EE10. A list of the forcing data is accessed using a LMC on the External Forcing Data menu shown in Figure 1. The number of series that have been generated is shown in brackets. Some of the items in the menu have unique options which are described in the particular page for that option.
The time series for the external forcing data can be assigned to boundary groups and cells later in the Boundary Condition tab. The display on the right of Figure 1 provides the user with a summary of the current assigned boundary groups and input tables, time series.
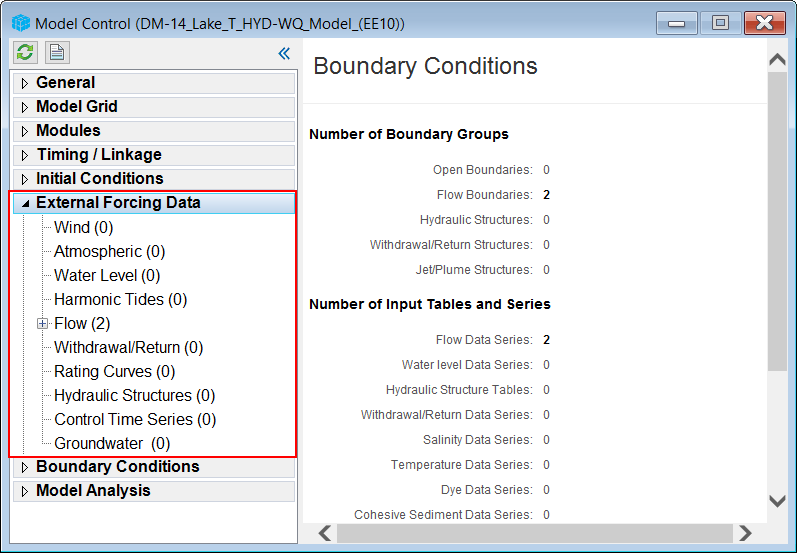
Figure 1. External Forcing Data menu and report.
LMC on any item will display a report about the item selected while RMC displays the options to Add New Data Series and Import Existing EFDC Formatted Series. If data series have already been added, the user can edit it with Edit Data Series and view a plot with View Data Series.
- Add New Data Series allows the user to create a new data series with user's inputs and options.
- With the Import Existing EFDC Formatted Series option, the user can browse to an existing EFDC data file ( QSER.INP, ASER.INP, PSER.INP,....) and the data file will be imported as a data series.
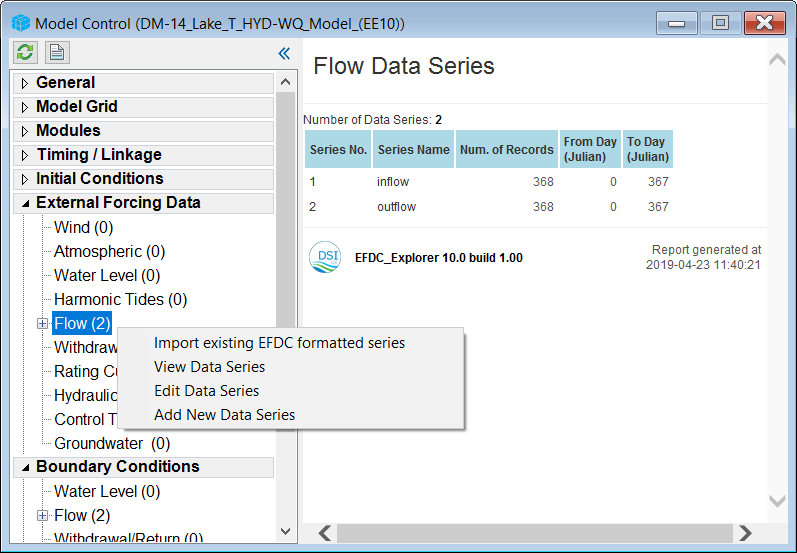
Figure 2. External Forcing Data: sub-menu options.
Add New Data Series
Figure 3 shows the Boundary Data Series general form that is displayed when the user selects Add New Data Series. Except for Harmonic Tides and Hydraulic Structures, all other sub-tabs use this general form. This form can have more options depending on the sub-tab selected.
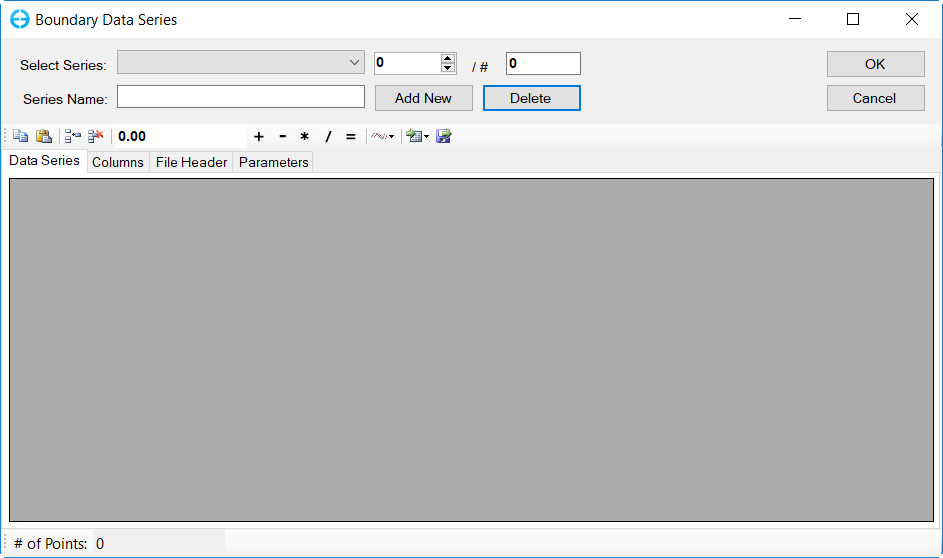
Figure 3. General form of Boundary Data Series.
The user can add and delete series with Add New and Delete. Added series will appear in Select Series, the user can select a series using the drop-down list. The name of a series can be edited in Series Name. Press "Enter" afterward to apply the edit.
View Series ![]() button will plot the series using EFDC_Explorer plotting tool. The user can choose to plot multiple series and multiple layers in a graph using View Options.
button will plot the series using EFDC_Explorer plotting tool. The user can choose to plot multiple series and multiple layers in a graph using View Options.
The user can copy the data from data file and paste it directly in to the table as in Figure 4. This table behaves like a Microsoft Excel (c) table where the user can use Shift and Ctrl keys to select multiple cells and includes options like Copy Data, Paste Data, Insert Row, Delete Row buttons as highlighted in Figure 4 .
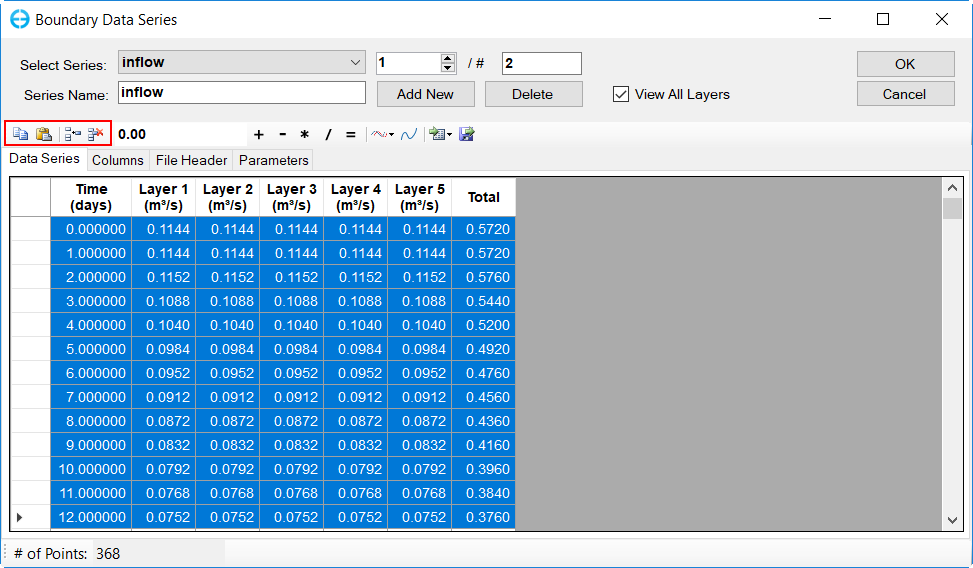
Figure 4. Data Series table.
Import Series form
An alternative option is to import an existing ASCII data file and replace the current series data with the new data with the Import Series ![]() button (Figure 5 )
button (Figure 5 )
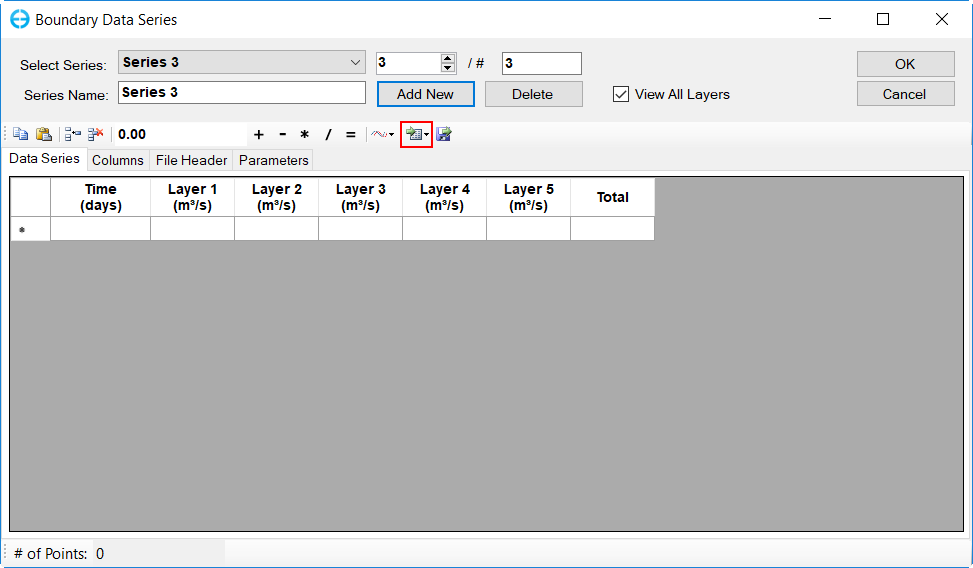
Figure 5. Import Series button.
Once the user does this an ASCII Data Import form will appear as shown in Figure 6. The user can choose the data file to import with the Browse button. Various import settings can be adjusted here such as Header Rows to Skip, and Data Base Date.
The following provides a quick guide to the use of the ASCII data import form:
- Select the data file to import using the Browse button.
- Select the delimiter.
- The Data Column to Import should point to the column number that contains the Y data. If there are more than two columns in the data file, it is advised to select Multiple Columns button and assign which type of data the columns is.
- As changes are made the information in the Data Preview frame provides the results of the current settings.
- Preview/graph the results of the current settings to see if the import results are what was expected. If not, make further adjustments, as needed, until the data imported plot is correct.
- Press OK to finalize the actual importing process.
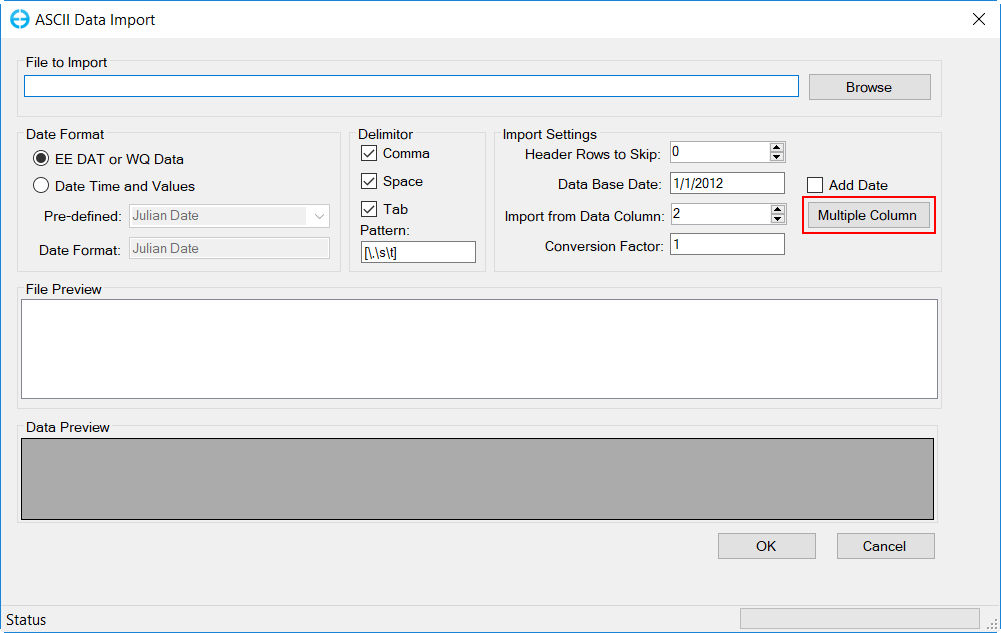
Figure 6. ASCII Data Import form.
Columns Format
The format of data series table can be changed in the Columns tab. The format in here follow the Standard Numeric Format Strings of C#. In this case F4 is a floating number with 4 decimal digits. The number 4 can be replaced for a different precision value.
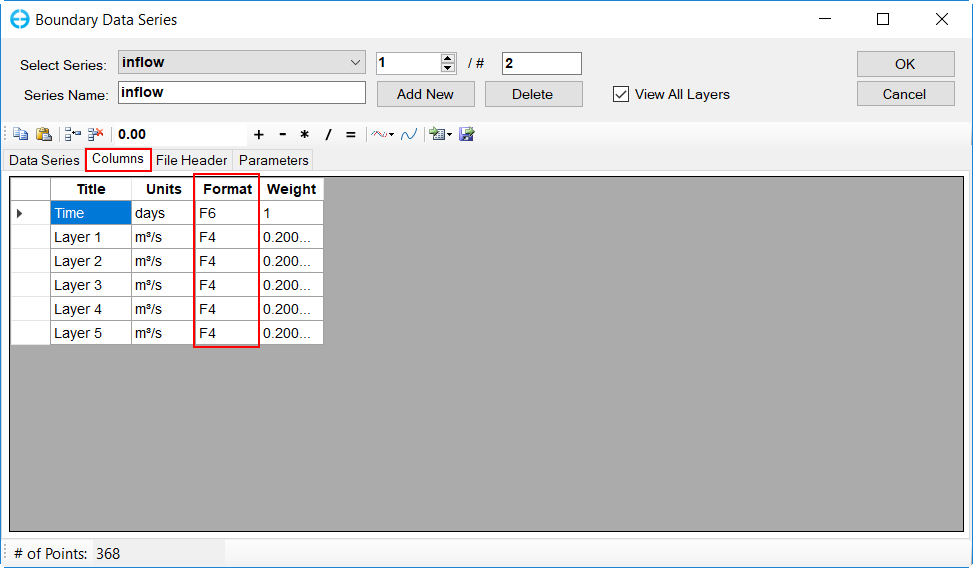
Figure 7. Edit data table format.
Apply Operators
The user may also apply operators to cells :
- Select cells to apply
- Enter the value for the operation
- Click on the button of the operators to Add, Subtract, Multiply, Divide or Assign the value of cell with the operator value.
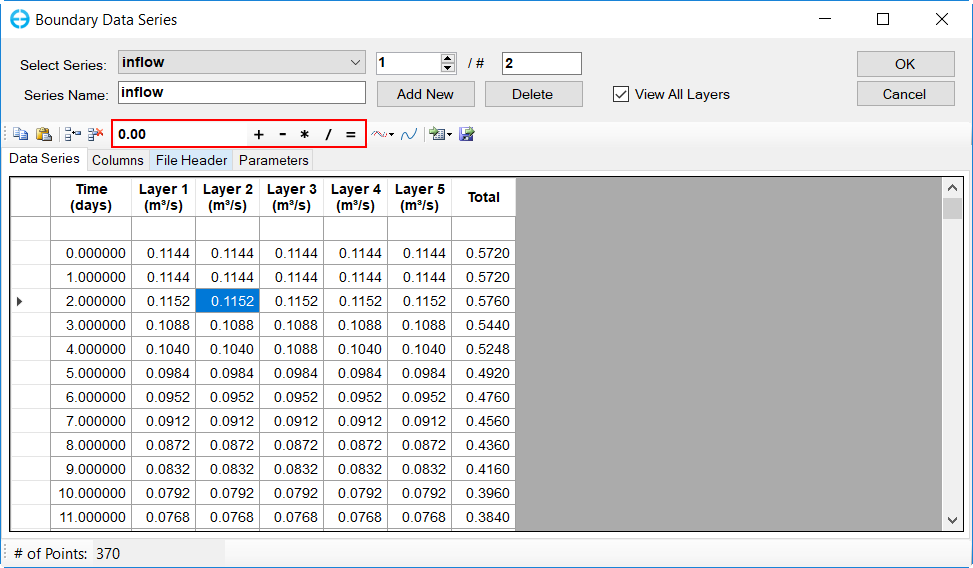
Figure 8. Apply operators to cells.