During both pre- & post processing of the model it is often helpful to be able edit and analyze the data via a series of 2 D Time Series Graphs. The shortcut keys which can be used to edit the graphs are shown in Figure 1. This form can be accessed via function key F2.
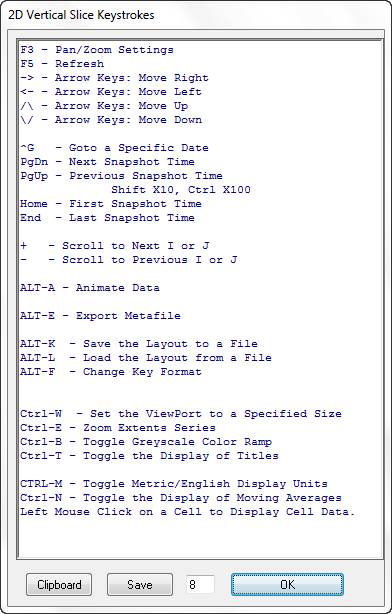
Figure 1 ViewProfile keystroke functions.