Activate the Salinity Module
The Graphical User Interface (GUI) for the Salinity module in EE can be activated from the EFDC+ Modules, as shown in Figure 1.
Anchor Figure 1 Figure 1
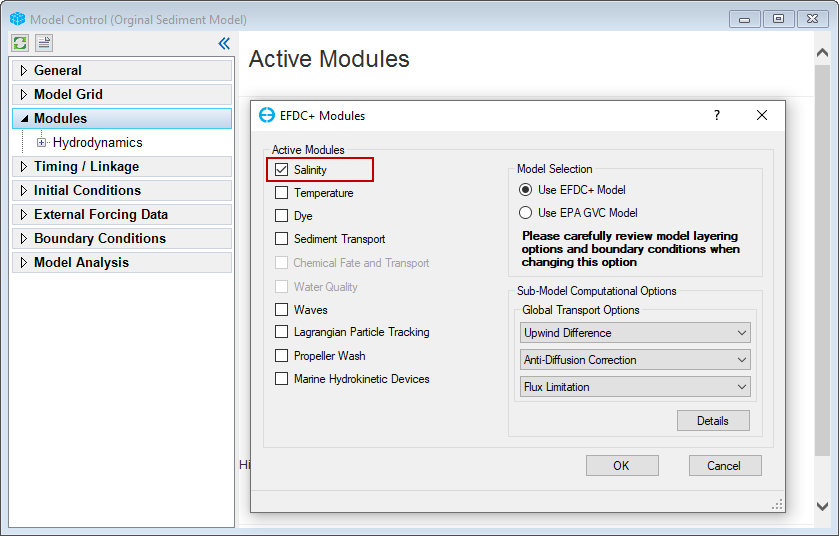
Figure 1. Active Salinity Modules.
Settings
After RMC on the Salinity module, the user can access the setting options and initial conditions options.
Anchor Figure 2 Figure 2
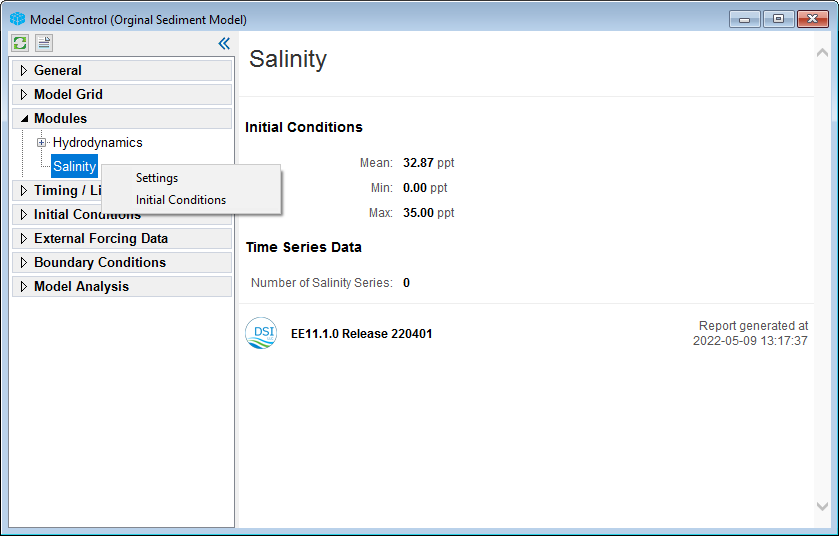
Figure 2. Model Control: Salinity Report.
Figure 2 shows the Salinity Parameters tab. This form is used to assign the initial conditions for the salinity parameters and edit the salinity time series.
Anchor Figure 2 Figure 2
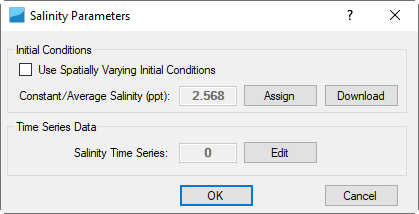
Figure 2. Salinity Parameters form.
Click Edit in Salinity Parameters form (Figure 2) to open Boundary Data Series form for the salinity (Figure 3). The Boundary Data Series is identical with the general form discussed in External Forcing Data. The time series can be assigned to boundary groups and cells later in the Boundary Condition tab.
Anchor Figure 3 Figure 3
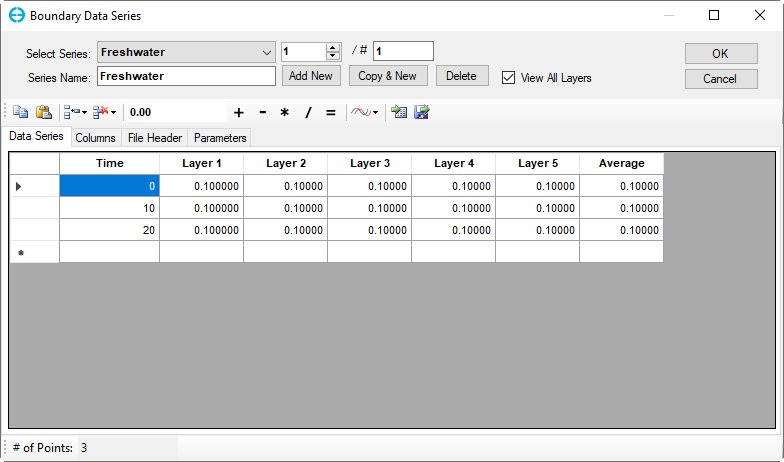
Figure 3. Boundary Data Series.
Initial Conditions
The initial conditions for salinity can be set a constant value or spatial varying by clicking Assign button, as shown in Figure 4.
The data if missing may be downloaded from online open sources by clicking Download button in Figure 4. It is able to select to apply the downloaded data for the whole model time range or just fill some missing periods.
Anchor Figure 4 Figure 4
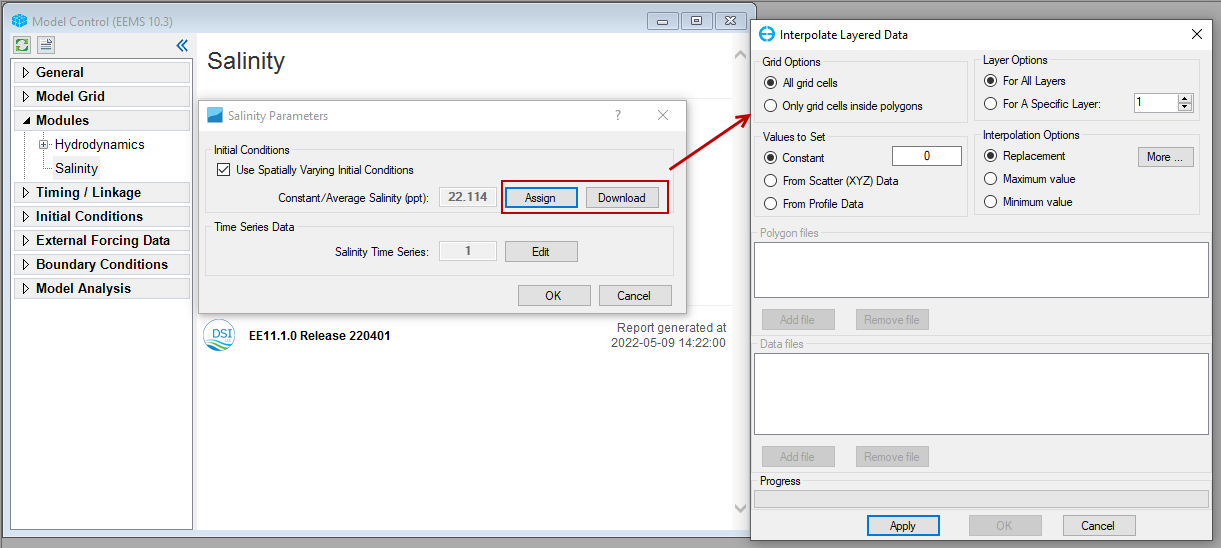 Figure 4. Salinity Initial Conditions.
Visualization
2DH View
The salinity can be visualized and animated in 2DH View. These can be added to the 2DH View by clicking the Add button in the 2DH View’s Layer Control then select Primary Group: Water Column and Parameter: Salinity as shown in Figure 5.
...
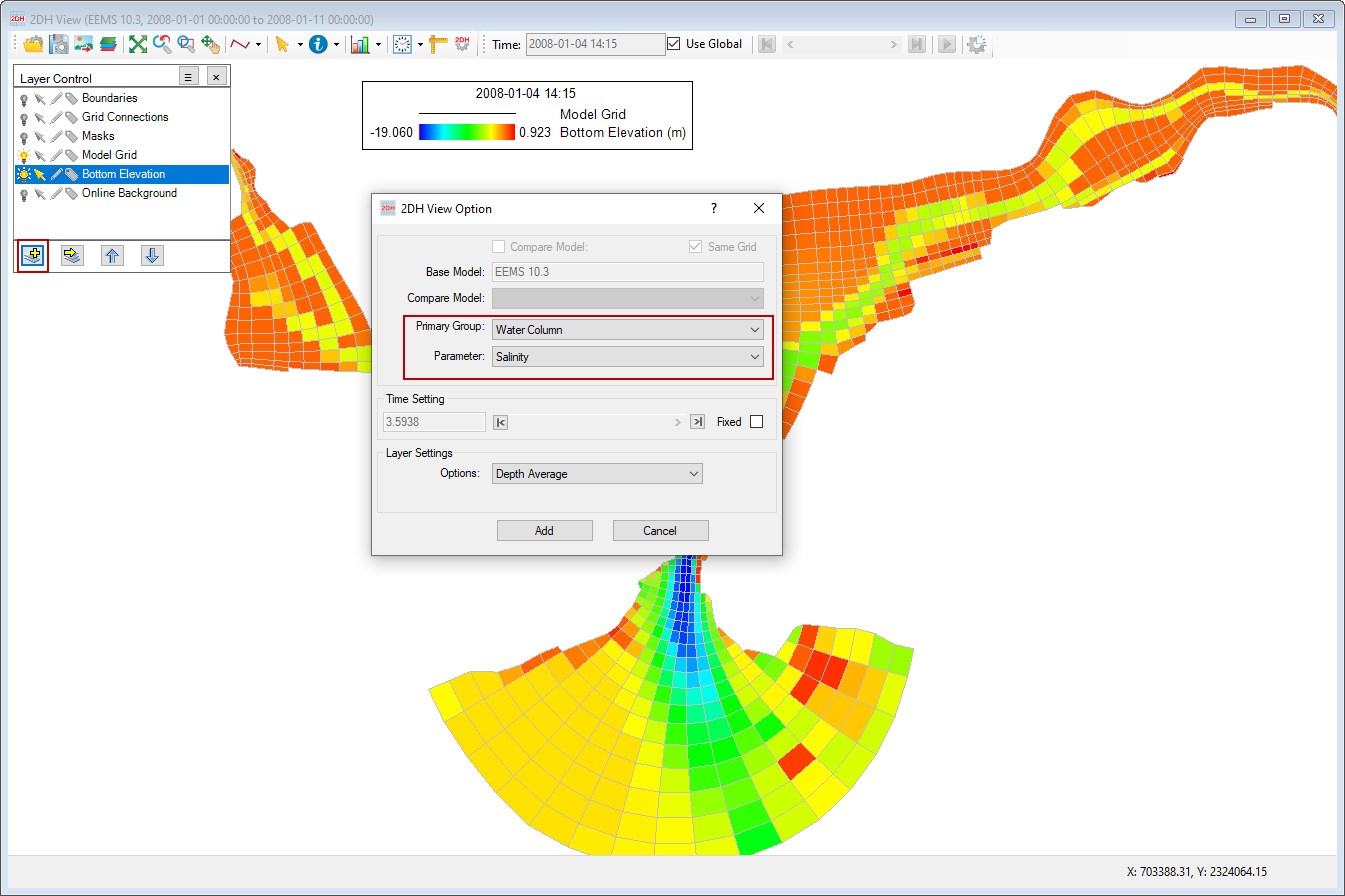
Figure 5. Salinity Layer in 2DH View.
Time Series
The graphic of the salinity time series can be visualized by clicking the Time Series button or the icon ![]() of the main toolbar. The Extract Time Series Data tab appears as shown in Figure 6. It is possible to plot the time series for a single cell or multiple cells. Firstly, defying the cells to plots is in the box under Selected Cells. When the L index is entered the corresponding I and J indices are filled automatically. The parameter should be defined in the box, Primary Group: Water Column and Parameter: Salinity. Add and remove the parameter can be adjusted by the left and right arrow button. The user may define the start and stop day for the time series in Time Series Start/Stop frame (note that the start and stop days should be within the model's start and end date). Clicking OK plots the selected graphs (Figure 7).
of the main toolbar. The Extract Time Series Data tab appears as shown in Figure 6. It is possible to plot the time series for a single cell or multiple cells. Firstly, defying the cells to plots is in the box under Selected Cells. When the L index is entered the corresponding I and J indices are filled automatically. The parameter should be defined in the box, Primary Group: Water Column and Parameter: Salinity. Add and remove the parameter can be adjusted by the left and right arrow button. The user may define the start and stop day for the time series in Time Series Start/Stop frame (note that the start and stop days should be within the model's start and end date). Clicking OK plots the selected graphs (Figure 7).
...
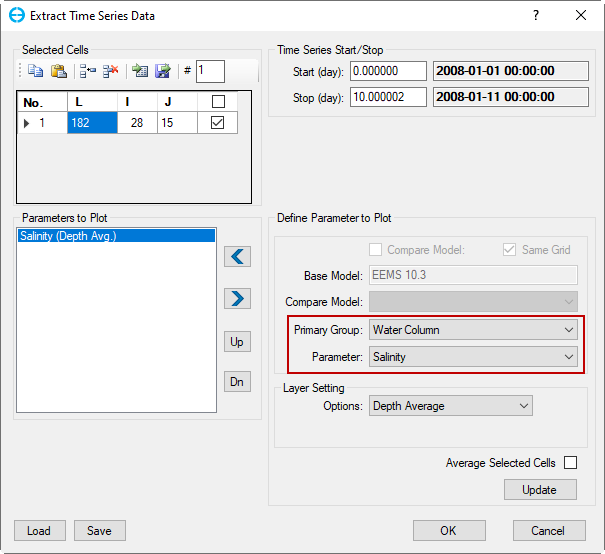
Figure 6. Extract Time Series Data.
...
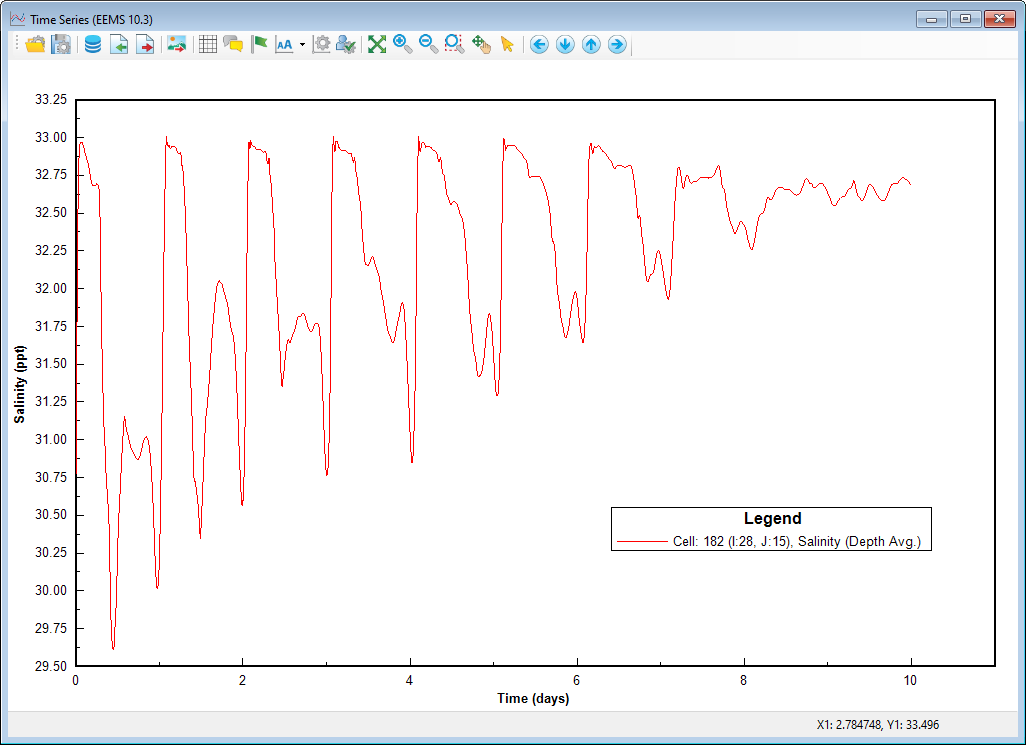
Figure 7. Salinity Time Series.
Vertical Profiles
The graphic of salinity vertical profiles can be visualized by click the Vertical Profile button or the icon ![]() of the main toolbar. The Vertical Profiles tab shows in Figure 8. It is possible to plot the vertical profiles for a single cell or multiple cells. Firstly, defying the cells to plots is in the box under Selected Cells. When the L index is entered the corresponding I and J indices are filled automatically. The parameter should be defined in the box, Primary Group: Water Column and Parameter: Salinity. Add and remove the parameter that can be adjusted by the left and right arrows. It is possible to import an external file to compare with model results, that function is useful for the model calibration and validation.
of the main toolbar. The Vertical Profiles tab shows in Figure 8. It is possible to plot the vertical profiles for a single cell or multiple cells. Firstly, defying the cells to plots is in the box under Selected Cells. When the L index is entered the corresponding I and J indices are filled automatically. The parameter should be defined in the box, Primary Group: Water Column and Parameter: Salinity. Add and remove the parameter that can be adjusted by the left and right arrows. It is possible to import an external file to compare with model results, that function is useful for the model calibration and validation.
...
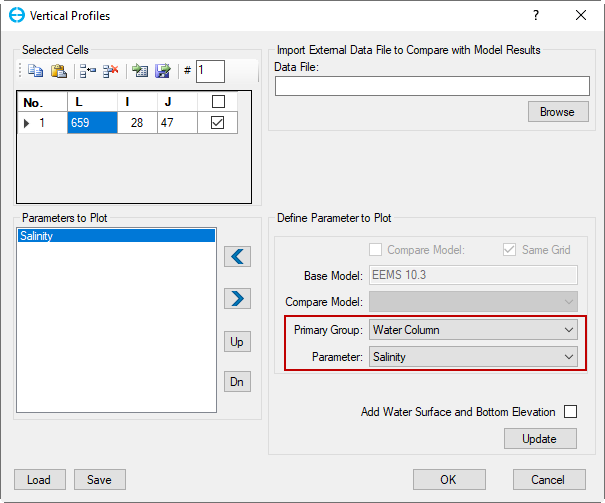
Figure 8. Vertical Profiles.
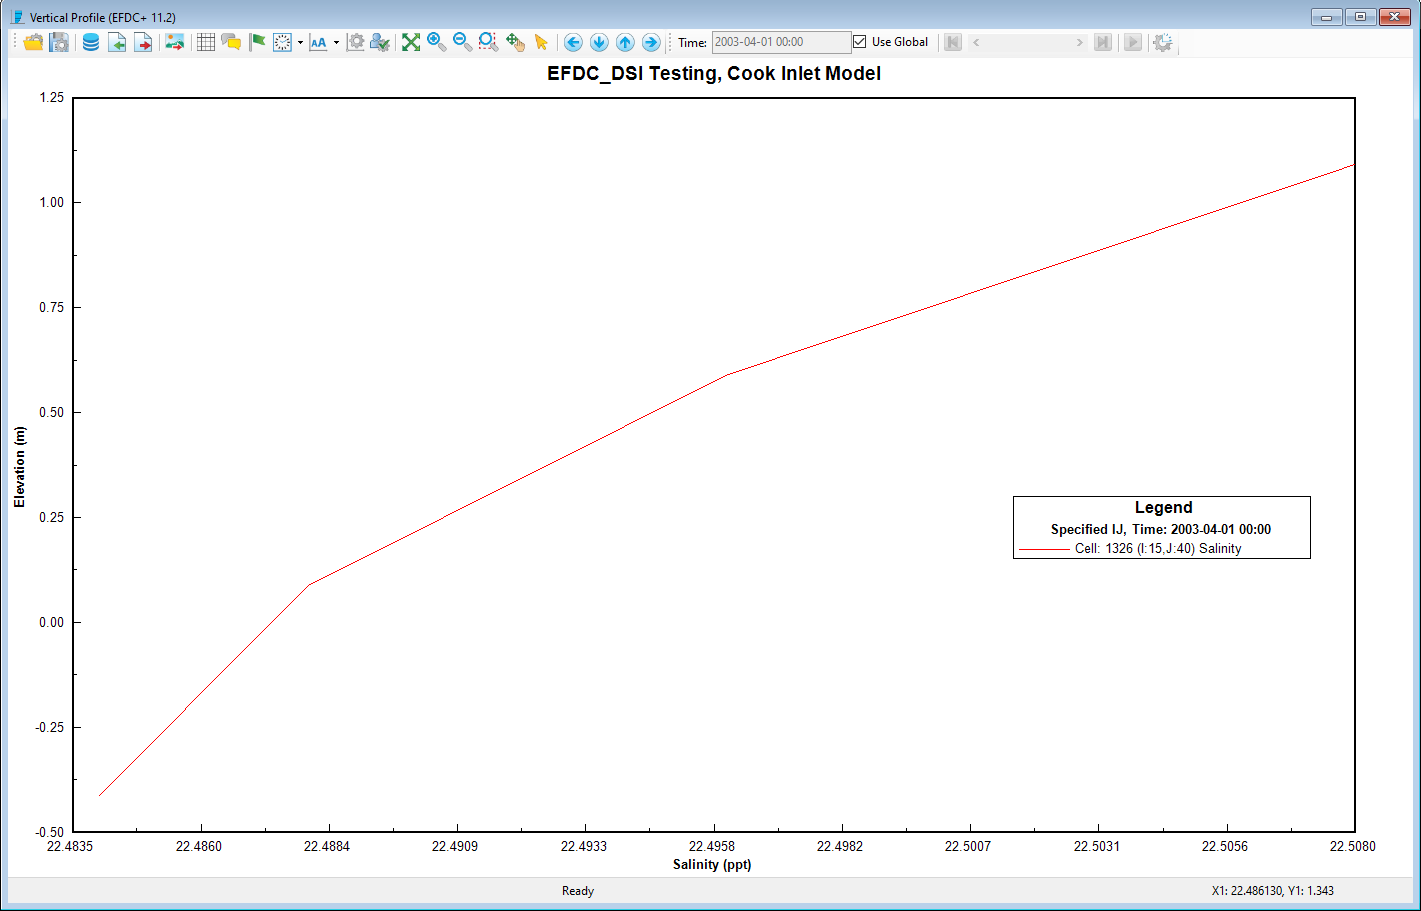
Figure 9. Salinity Vertical Profiles.
Longitudinal Profiles
The graphic of salinity longitudinal profiles can be visualized by click the Longitudinal Profile button or the icon ![]() of the main toolbar. Figure 10 show the Data Extraction for Longitudinal Profile form. This form is similar to the Data Extraction for 2DV View form. Firstly, it is necessary to define the profile using the drape file or I, J indices and then define the parameter to the plot. Once everything is ready, click OK to generate the plot. Figure 11 shows a longitudinal profile for salinity and bottom elevation along with the profile I=56.
of the main toolbar. Figure 10 show the Data Extraction for Longitudinal Profile form. This form is similar to the Data Extraction for 2DV View form. Firstly, it is necessary to define the profile using the drape file or I, J indices and then define the parameter to the plot. Once everything is ready, click OK to generate the plot. Figure 11 shows a longitudinal profile for salinity and bottom elevation along with the profile I=56.
.
...
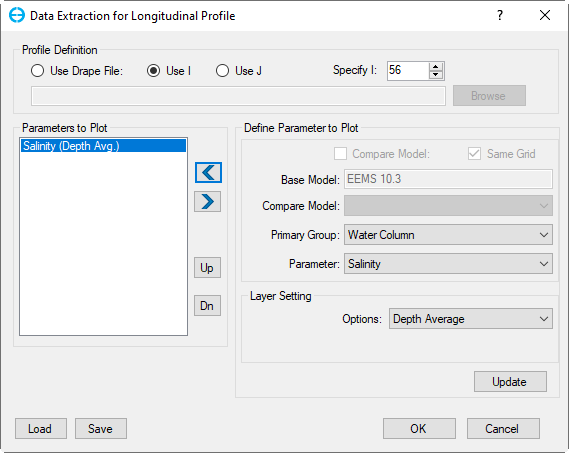
Figure 10. Data Extraction for Longitudinal Profile.
...
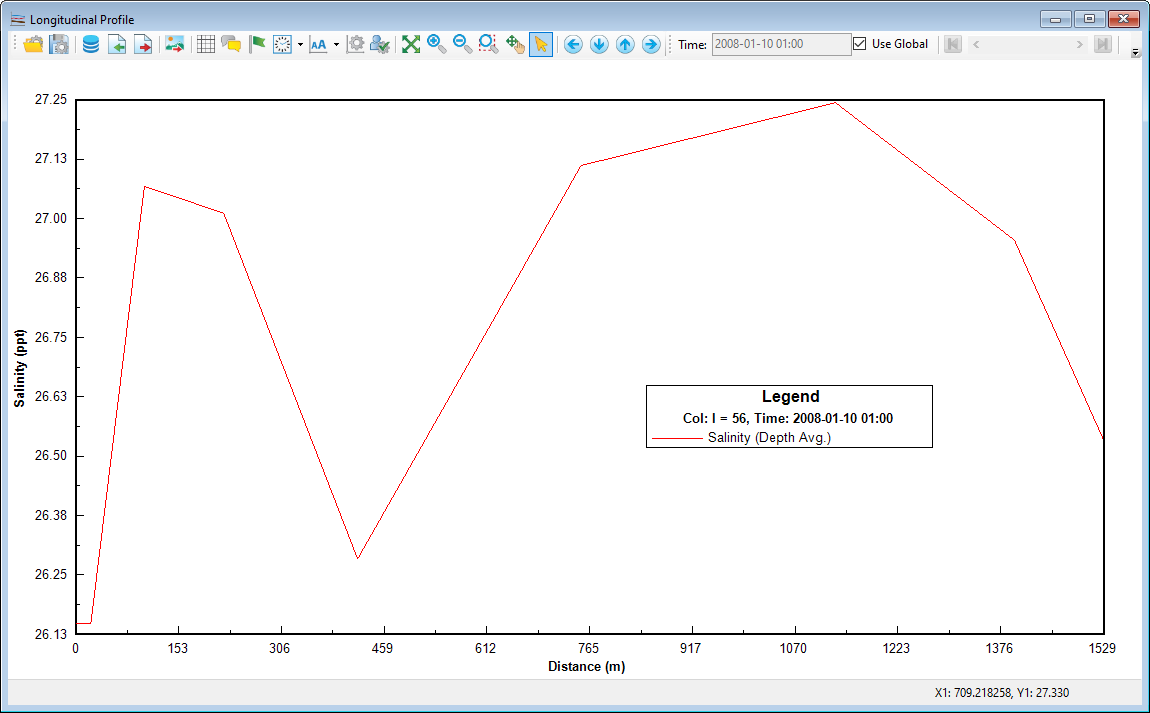
Figure 11. Salinity Longitudinal Profile.