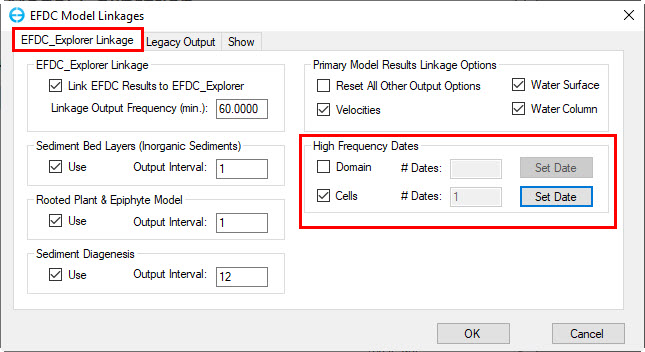
The High Frequency Dates option is an EFDC+ option that inserts higher frequency output snapshots into the base snapshot frequency defined in the EFDC Model Linkages form shown in Figure 1. This function allows the user to use a larger base snapshot frequency, resulting in smaller output files and faster post processing times, and still capture specific times in detail. This approach is very useful when matching model results to specific sampling events.
| Anchor | ||||
|---|---|---|---|---|
|
Figure 1 Timing/Linkage Tab: EFDC Model Linkages.
Selecting the Domain check box and then setting the calendar date (or Julian date), frequency and duration of the snapshots, creates high frequency snapshots covering the whole model domain for the time specified. This approach will clearly lead to slower run times than the approach described above.
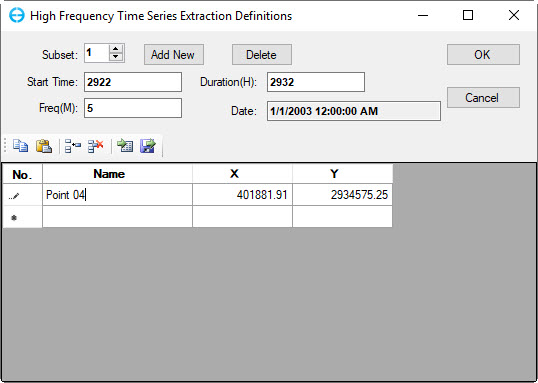
Checking the Cells checkbox (as in Figure 1) and selecting the Dates button provides the user with the option of creating high frequency snapshots of individual cells as shown in Figure 2. The user may create any number of subsets of the model domain by inputting a number in the Subsets box. Further subsets may be added one at a time with the Add New button.
| Anchor | ||||
|---|---|---|---|---|
|
Figure 2 Timing/Linkage: High frequency snapshots by subset
The Subset frame shows which subset is in view at any given time and allows the user to cycle through the subsets with the up/down arrows next to Subset box. The Start Time, duration (in hours) and frequency (in minutes) are set by the user for each subset of cells. Cells are defined by their X, Y coordinates and may be designated with an ID for easy reference.
High Frequency Time Series Plot
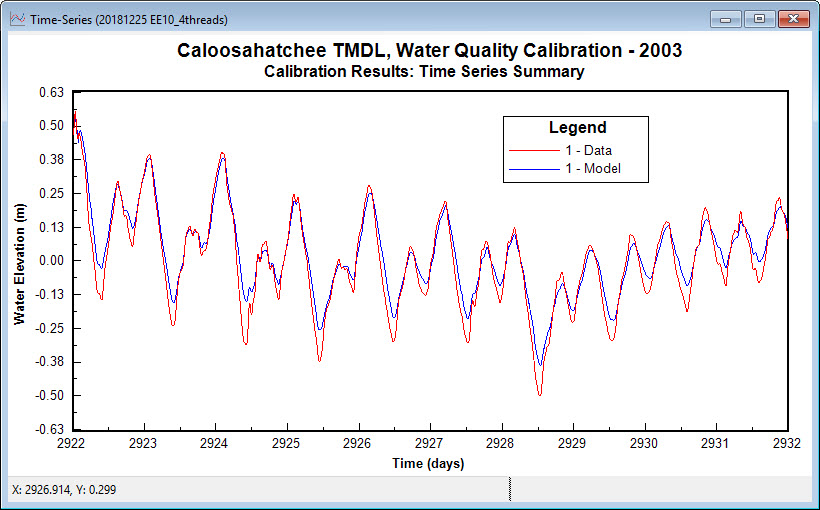
Settings and functional options for High Frequency Time Series Plot are the same as for Calibration Time Series. An example of a high frequency time series plot is shown in Figure 3.
| Anchor | ||||
|---|---|---|---|---|
|
Figure 3 An example of High Frequency Time Series plot for water elevation.


