...
Figure 4 Weighted Usable Area time series.
View Habitat Suitability Index in 2DH View
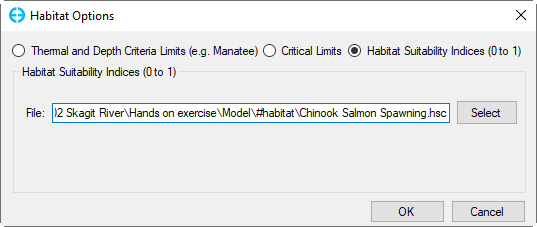
Once a time series has been generated, user can go to 2DH View window to view the habitat suitability index of each cell change by the time. From 2DH View window, users press keystroke Ctrl + H to open Habitat Options form as shown in Figure 5. From this form, select Habitat Suitability Indices option then click on Select button to browse to *.HSC file.
| Anchor | ||||
|---|---|---|---|---|
|
Figure 5 Habitat Options form.
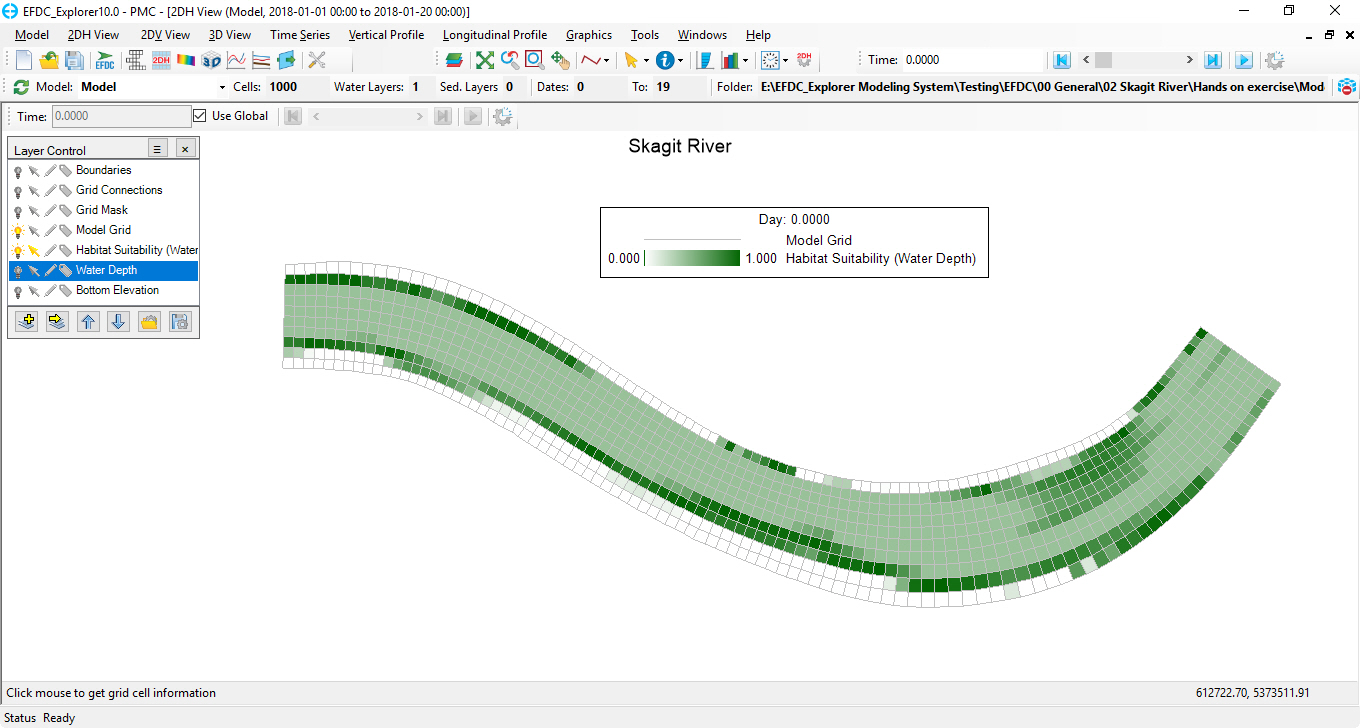
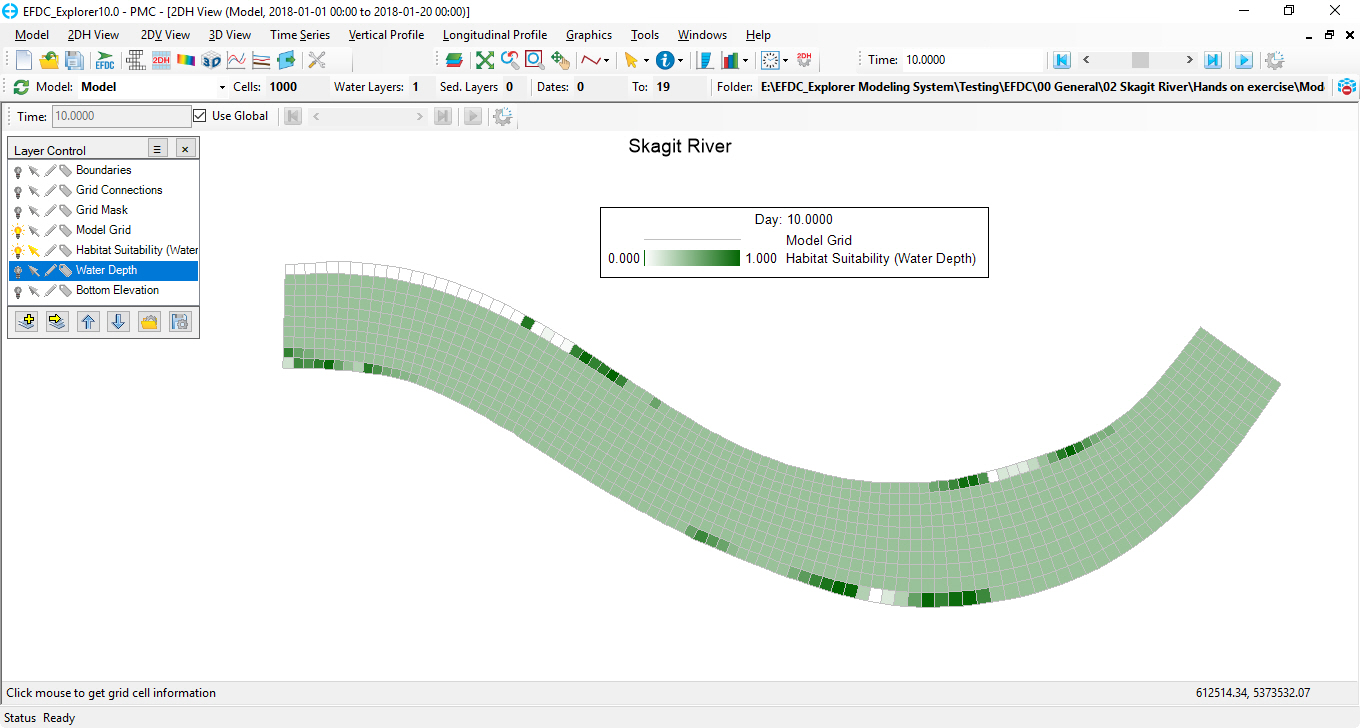
Habitat Suitability index of the interested species will be displayed at each time step as shown in Figure 6 and Figure 7 below.
| Anchor | ||||
|---|---|---|---|---|
|
Figure 6 HSC results at time step 0 in 2DH View.
| Anchor | ||||
|---|---|---|---|---|
|
Figure 7 HSC results at time step 10 in 2DH View.


