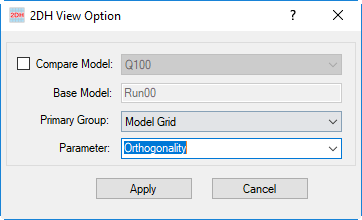
In the The Model Grid primary group includes the following parameters:
- MPI Subdomain
- MPI Active Cells
- Model Grid
- Masks
- Grid Connections
- Channel Modifier
- Orthogonality
- Cell Rotation
- Cell Index
Cell Index
This Viewing Opt displays the EFDC indexes of I & J and the linear index "L" on a cell map based on LXLY coordinates. The data posting label format is used to display the indexes.
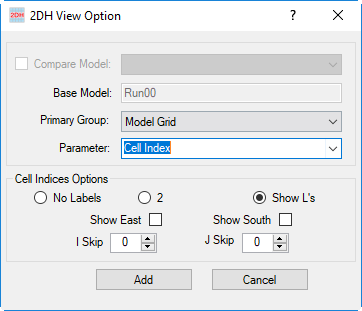
Select Cell Index for Parameter, in the Cell Indices Options as shown in Figure 1 258474017, the user can select options for displaying.
...
Finally the user click Add button to add the Cell Indices layer to the Layer Control. The cell indices are displayed as shown in Figure 2 258474017.
| Anchor | ||||
|---|---|---|---|---|
|
Figure 1. 2DH View: Cell Index (1).
...
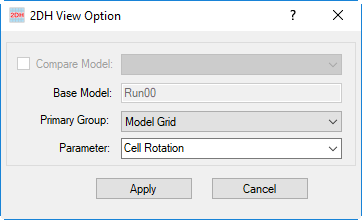
This viewing option displays the rotation angle of grid cells. Select Cell Rotation for Parameter, then click Apply button as shown in Figure 3 258474017. The cell rotation is displayed as shown in Figure 4 258474017.
Anchor Figure 3 Figure 3
Figure 3. 2DH View: Cell Rotation (1).
...
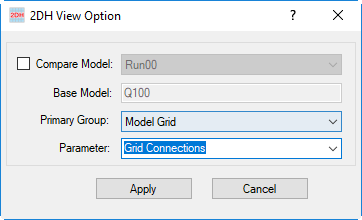
This viewing option displays the grid connections as North-South or East-West connections for the model which contains sub-grid domains. Select Grid Connections for Parameter, then click Apply button as shown in Figure 5 258474017. The grid connections are displayed as shown in Figure 6 258474017.
Anchor Figure 5 Figure 5
Figure 5. 2DH View: Grid Connections (1).
...
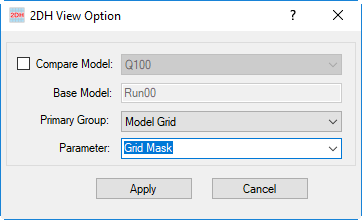
This viewing option displays the grid masks for the model which contains grid masks. Select Grid Mask for Parameter, then click Apply button as shown in Figure 7 258474017. The grid masks are displayed as shown in Figure 8 258474017.
Anchor Figure 7 Figure 7
Figure 7. 2DH View: Grid Mask (1).
...
This viewing option displays the orthogonality of the model grid. Select Grid Mask for Parameter, then click Apply button as shown in Figure 9 258474017. The grid masks are displayed as shown in Figure 10 258474017.
Anchor Figure 9 Figure 9
Figure 9. 2DH View: Orthogonality (1).
...
