This section will convey how to configure and use the equation-based structures and flow table based hydraulic structures listed in the Flow Control Type drop-down menu in Hydraulic Structure Boundary Conditions form.
Whole Channel Rating Curve
EEMS provides the option of setting a boundary that is defined by a single rating curve to represent the river. This feature is useful if the user wants to create stepped flows for a IFIM habitat analysis.
The option Whole Channel Rating Curve acts much like a flow table, or flow time series, which may be split with a flow multiplier across different cells. Using the scroll bar in the Setting for Current Boundary Cell frame allows the user to see how the multiplier changes.
The user also has the option of setting a downstream cell that the flow will return into in the Downstream Cell frame. If this is left blank, then EE ignores the downstream end.
Upstream Depth and Elevation Difference Options
The hydraulic structure boundary condition option that uses flow derived from upstream depth, or elevation difference, uses a head lookup table to describe the relationship between head and flow for that cell. This is selected with Flow Control Type menu. Several options are available for the flow control type including:
If the Elevation Difference with Flow Acceleration option is selected the flow acceleration parameter flows are now squared and multiplied by an acceleration factor when passing through an inlet.
Flow Derived from Upstream and Downstream Elevations
Another option is to use flow derived from upstream and downstream elevations. In the example shown in Figure 5, Pacheco Outlet uses such a control type. In this case it is necessary to have a matrix to describe the relationship between head and flow as shown in Figure 6. Most data tables, such as those by the US Corp of Engineers, use the same downstream and upstream head. Therefore, if the user wants to change the table, they should selectEdit Heads, and add a new table. WhenAccept Headsis selected a new row and column will be created.
Figure 5 Structure Boundary Conditions: Flow from US and DS Elevations.
Figure 6 Hydraulic Structure BC Editing: Flow from US and DS Elevations.
This matrix may be plotted by selecting theView Series | Currentoption. This displays the graph as shown inFigure 7. As there are often too many series to plot, the user is prompted for a skip interval so that some lines are not displayed. The user may also select a specific upstream head to plot.
Figure 7 Flow from US and DS Elevations.
Flow derived from Upstream Depth or Elevation Difference with Low Chord
One use of hydraulic structures is to simulate a low chord, i.e. the bottom of a bridge. In this case, when flows are below the bridge deck they may be bi-directional, i.e. flows can be going upstream or downstream. However once the bridge is overtopped flow is only upstream to downstream.
EFDC uses the total flow rate for the flow calculations, therefore it requires the flow to be at the actual time when the cell reaches the low chord elevation. The elevation is then subtracted from the value obtained from the rating curve as this curve defines the relationship for the total flow around the bridge for the whole range of depths. It is necessary to subtract the actual flows from the curve to prevent a large jump in flow. To prevent instability at the transition the minimum number of time steps above the low chord may be provided by the user. An example of how this is setup is shown inFigure 8.
Figure 8 Hydraulic Structure BC: Low Chord Option.
In the equations for the head look up tables (Figure 8), HQCTLU is set on a cell by cell basis. HCTLUA comes from cell options offset.
The table for CTRL_1 is defined by the user as shown inFigure 9.
This boundary condition needs to be turned on for each cell. However, to enter one value for all the cells in a group the user may select all (CTRL A) and then apply to all the cells in that group. The 3D view of the backwater effect from the bridge is shown inFigure 10and the original animationhere. Note that the bridge must be of a size larger than the grid size for this option to work effectively.
It is recommended that users set a common low chord elevation for adjoining cells and pay attention to the bathymetry for those cells. While it is possible to set a different low chord elevation for adjoining cells, if they have different values then flow will pass from cell to cell across the bridge and cause model instability. In the same way, sudden change of bathymetry between the cells may also create oscillations. To prevent this it is suggested to use masks.
Figure 9 Hydraulic Structure Editing Form: Low Chord.
Figure 10 Bridge (Low Chord) Hydraulic Structure in View3D.
Culverts
To assist the user define the input parameters for the culvert, a Definition Editor is provided as shown in Figure 3. This form can be accessed by clicking on Edit button in Figure 2. Here the user may define the Equation ID, allowing various culverts dimensions and type to be defined.
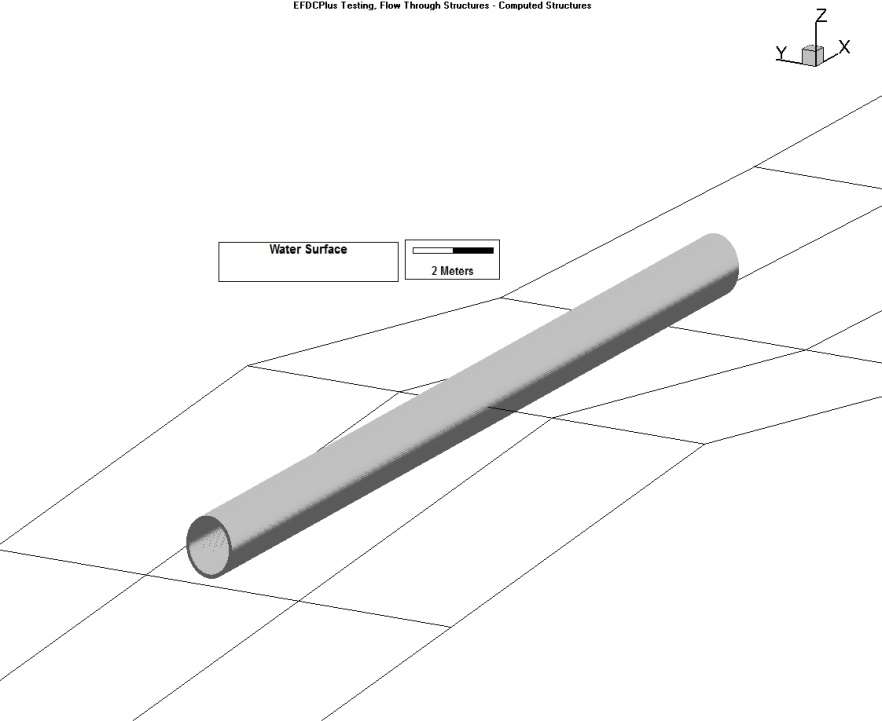
The user should select the Hydraulic Structure Type from the drop-down menu. In this case, the option chosen is "culvert". The user should then select the Cross-section type. Depending on the options chosen the image of the culvert will change to match the user's selection. The user can then specify the culvert dimensions in meters, including upstream and downstream elevations of the pipe, length of the pipe, Manning's roughness coefficient and diameter of the pipe as shown in Figure 3. The user may also import 3D structures to better visualize the hydraulic structures in EE8 as shown in Figure 4. An animation of an example culvert may be seen here.
Figure 3 Hydraulic Structure Equation Editor: Culverts.
The methods for determining flow through culverts are based on the culvert flow type classification and analysis from Chow (1959). This methodology describes six different types of culvert flow based on the location of the control section within the culvert and the relative elevations of the headwater, tailwater, and culvert invert and crown elevations in meters. The discharge is primarily computed using Manning's equation which can be expressed as:
Q= KS1/2
Where conveyance, K= (A/n)R(2/3) and where A = cross-sectional flow area (m); n = Manning's roughness coefficient, and R = hydraulic radius (m).
Figure 4 Image of culvert in View3D.
Sluice Gates
The sluice gate hydraulic structure boundary has been enhanced to simulate the opening and closing of gates. Currently two types of sluice gate operation are supported: operational time series, and operational rules.
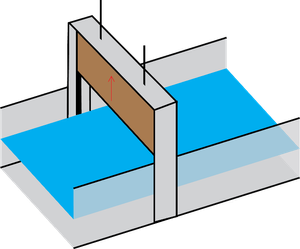
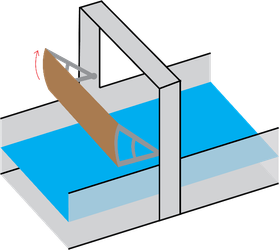
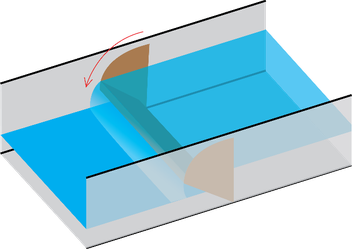
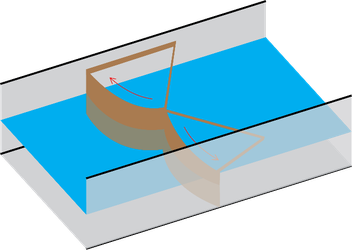
With the operational time series option, the gate is opened or closed during the simulation based on a defined time series of the operational state and settings such as rate of gate opening, and maximum opening height. Examples of the types of gates may be shown in Figure 5.
a) Structures with upward opening | |
b) Structure with downward opening | c) Structures with sideward opening |
Figure 5 Operation for different types of gates.
When using the equation based hydraulic structures, if the user selects Equation: Sluice Gate, the Time Control dropdown menu will be displayed as shown in Figure 6.
Figure 6 Hydraulic Structures: Sluice gate controls.
The options available in this menu are as summarized in the table below and the final three options described in detail in the following sections.
Name | Meaning |
Uncontrolled Structure | The hydraulic structure is uncontrollable type. The previous method of flow computational using lookup table or equation will be used |
Controlled using Time-Series | The operation of the hydraulic structure is controlled using a time-series which defines the changes with time of gate openings or rating curves |
Controlled based on Upstream Elevation | The operation of the hydraulic structure is controlled using control rules defined based on water surface elevation at an upstream location. This location can be different from the upstream cell of the structure. |
Controlled based on Head Difference | The operation of the hydraulic structure is controlled using control rules defined based on the difference of water surface elevations at two locations upstream and downstream of the structure. These locations can be different from the upstream and downstream cells of the structure. |
Time-Series Control of Sluice Gates
When the flow control type of Controlled using Time-Series is selected for sluice gate, the user can select which time-series will be used for the structure by selecting the corresponding item in the Table dropdown list in Time Variable Hydraulic Structure Control group (Figure 7). To create new time series, or edit an existing one, the user can click on Edit button beside the Table dropdown list to edit the control time-series which is shown in Figure 8.
Selecting the Show Params button provides the user with more control over which parameters from the time series will be used to control the gate. Parameters that can be selected for the sluice gate include the initial opening height, opening width, sill level change, number of units, flow discharge and rating curve. A setting of “1” means that this parameter is used in control calculations. A setting of “0” means this parameter is ignored. In this example only gate height is set to 1. Other parameters are left to 0, meaning only the opening height of the gate will change with time.
Figure 7 Sluice gate control using a time-series.
Figure 8 Data Series: Time series for sluice gate control.
Control Rules from Upstream Elevation or Head Difference
When the flow control type of "Controlled based on Upstream Level" or "Controlled based on Head Difference" is selected, the user can select which control rules will be used for the structure by selecting the corresponding item in the Control Rules dropdown list in Time Variable Hydraulic Structure Control group shown in Figure 9.
To create a new set of control rules, or edit an existing set, the user can click on Edit button beside the Control Rules dropdown.
Figure 9 Hydraulic structure: Sluice gate control using operational rules.
The hydraulic structure control rules are shown in Figure 10. Here the user can configure the number of sets of rules with Number of Rules, and then scroll between the sets with Current Rule menu. For each set of control rules, the user must configure which parameters the rules are to be set for: opening height, opening width, and sill level (height above bottom of structure) change. The actual rules require the following settings:
- Control value: the elevation or (head difference) which will trigger the gate to start to open or close
- State: the direction of the opening or closing. Opening is configured with a “1” and closing is configured with “0”
- Height: opening height to which the structure can rise or fall
- Width: the opening width (m) of the gate at (for sideward opening).
- Sill Level Change: the sill level change (m) of the gate. Default is zero.
- Rate: the rate of increase or decrease of the gate opening.
EE uses the “state” of the structure to allow the user the high level of control required to simulate realistic scenarios. The logic of the process is that if the state of the structure is “1” then it is currently opening, and the rate of opening determined by the Rate. This will occur from that trigger level until it reaches another trigger level, or it reaches the Height assigned (presumably the maximum opening). Once it reaches the maximum opening the rate no longer applies and the final flow rate is maintained. When a trigger is reached with state of “0” the gate will close, and flow decrease at the set Rate. This continues until it reaches the Height assigned (presumably fully closed).
Figure 10 Operational rules configuration for sluice gate.
Figure 11 shows the form for setting the initial condition of the hydraulic structure. As described above, the location of the hydraulic structure trigger does not have to be in the same cell as the actual structure. Here the user can configure the upstream and downstream locations of the control triggers in the Time Control Locations frame. The user should also configure the initial conditions: whether the gate is opening or closing, and the initial height width and sill level change, if any.
Figure 11 Initial Conditions for gate operation.
Sluice Gate Equation Editor
To assist the user define the equation parameters for the sluice gate, a Definition Editor is provided as shown in Figure 12. The user should define the Equation ID, for various sluice gates to be defined.
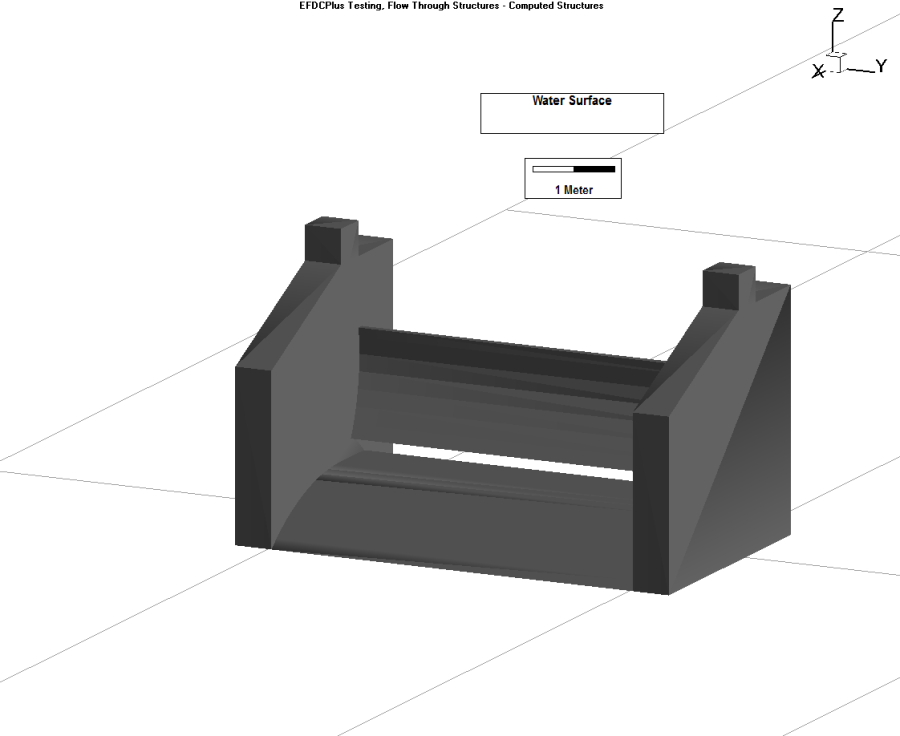
The user should select the Hydraulic Structure Type from the dropdown menu, in this case it is "sluice gate". The user should then enter the sluice gate dimensions, including sill elevation, height, width, super-critical weir flow, sub-critical weir flow, free sluice flow and submerged orifice flow parameters as shown in Figure 12. The user may also import 3D structures to better visualize the hydraulic structures in EE8 as shown in Figure 13. An animation of an example sluice gate may be seen here.
Figure 12 Hydraulic Structures Equation Definition: Sluice gate.
Flow through a sluice gate can be characterized by two basic parameters: the tranquility of the flow (i.e., subcritical or supercritical flow) and the water depth (i.e., gate submerged or not).
The equation for free sluice gate flow is:
Where C3 and C4 are discharge coefficients for free flow and submerged orifice flow respectively, W is the width of gate, Hu and Hd are headwater and tailwater, respectively.
Figure 13 Image of sluice gate in View3D.
Weirs
To assist the user define the equation parameters for a weir, a Definition Editor is provided as shown in Figure 14. The user should define the Equation ID, for various weirs to be defined.
The user should select the Hydraulic Structure Type from the dropdown menu, in this case it is "weir". Four cross-section types are available to the user: rectangle, v notch, trapezoid and broad crested. This example shows a broad crested weir definition form which requires the crest elevation, width of the weir, and the co-efficient of discharge.
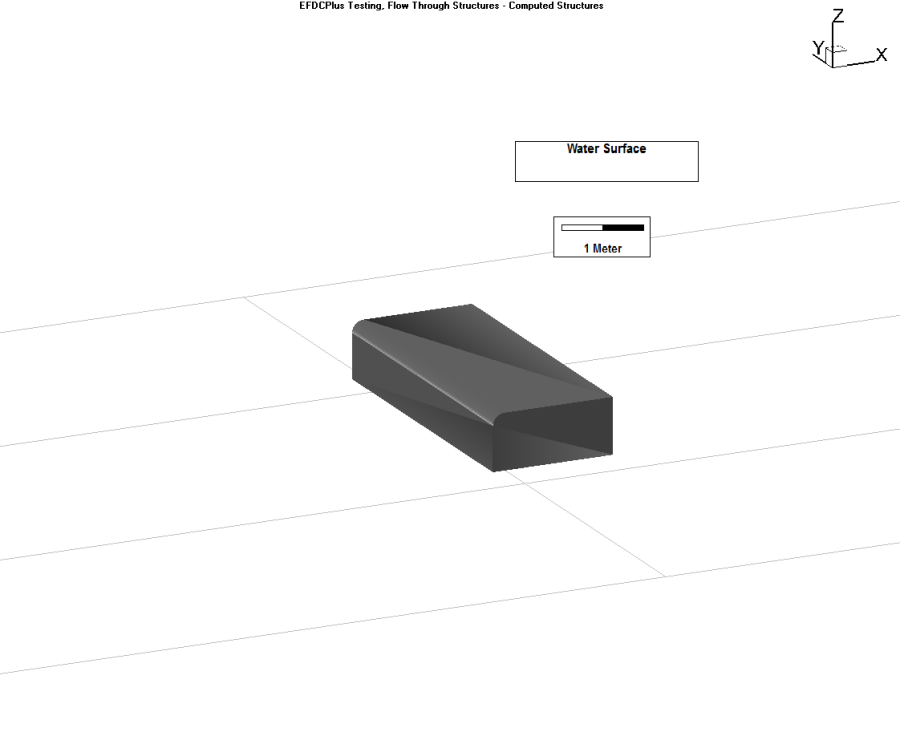
An imported 3D structure image (COLLADA file), used to better visualize the hydraulic structure in View3D is shown in Figure 15.
Figure 14 Hydraulic Structures: Weir definition form.
The equation to define the flow for weirs are as follows:
Where a is the ratio, C discharge coefficient and β is a exponent coefficient depending on the shape of flow cross-section.
Figure 15 Image of broad crested weir in View3D.
Orifices
To assist the user define the equation for an orifice, a Definition Editor is provided as shown in Figure 16. The user should define the Equation ID, for various orifices to be defined.
The user should select the Hydraulic Structure Type from the dropdown menu, in this case it is "orifice". Six cross-section types are available to the user: circle, half-circle, ellipse, half-ellipse, rectangle, v notch, and trapezoid. This example shows an orifice with a half circle cross section. The user should send the upstream elevation, diameter of the cross-section in meters, coefficient of discharge for a weir, and coefficient of discharge for an orifice.
An imported 3D structure image (COLLADA file), used to better visualize the hydraulic structure in View3D, is shown in Figure 17.
Figure 16 Hydraulic Structures: Orifice definition form.
The flow equations for the submerged orifice as defined as follows.
Figure 17 Image of half circle orifice in View3D


