...
To use this function, firstly, open EE then load loads the two models, large model, and nested model, the nested model must be set boundary conditions and have a same basedate with the same base date as the large model. Then click Model from the main menu, then select Model Nesting as shown in 263159883 Figure 2.
| Anchor | ||||
|---|---|---|---|---|
|
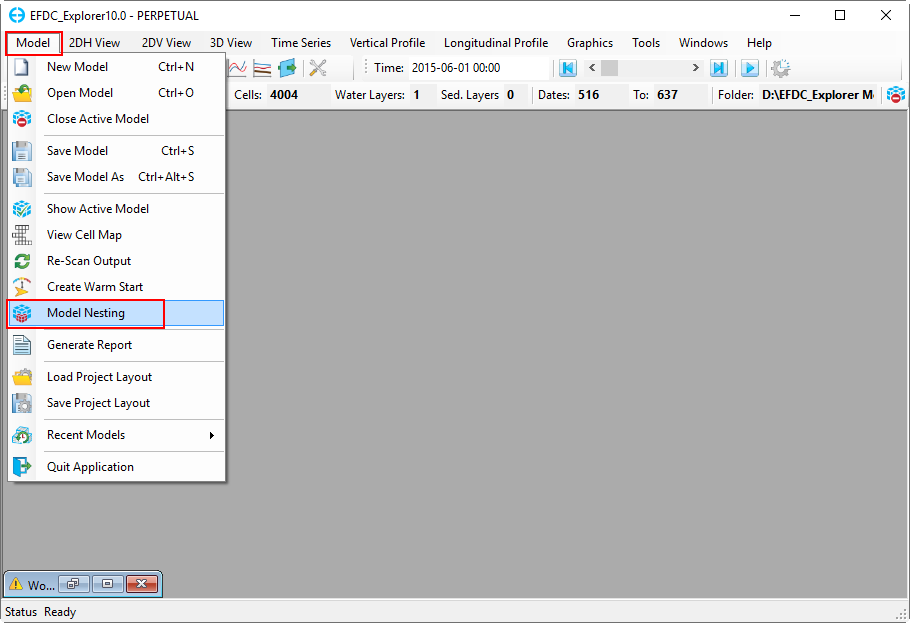
Figure 2 Model Nesting option.
The Model Nesting form appears as shown in 263159883 Figure 3.
In the Large Model frame:
Select Model: from the drop-down list, the user selects the large model (e.g Coarse_Model)
Time Begin and Time End: two of these fields are updated automatically from the model.
In the Detail Model frame:
Select Model: from the drop-down list, the user selects the nested model (e.g Nested_Model)
Time Begin and Time End: two of these fields are updated automatically from the model. however if it is different from the time of the large model, the user must adjust it so that the time of the large model covers the time of the detail detailed model.
In the Nesting Options frame:
There are four check boxescheckboxes, Bottom Elevation, Boundary Conditions, Initial Conditions, Restart Files. The check-boxes allow the user selects options from the large model that will be taken to the nested model.
...
Finally, click OK button to start the process of nesting. A message informs the nesting process completed as shown in Figure 4.
...
The nesting tool will extract and build a time series for each boundary condition cell. It will also assign the time series to the corresponding boundary conditions and set the initial conditions for the modules in the nested model.
The user need needs to update the rest of the Hydrodynamics for the Nested model, the same as the Coarse model and can then activate more modules if required.
An example of a comparison of time series output between the finer grid model and the coarse grid model is shown in 263159883 Figure 5.
Anchor Figure 5 Figure 5
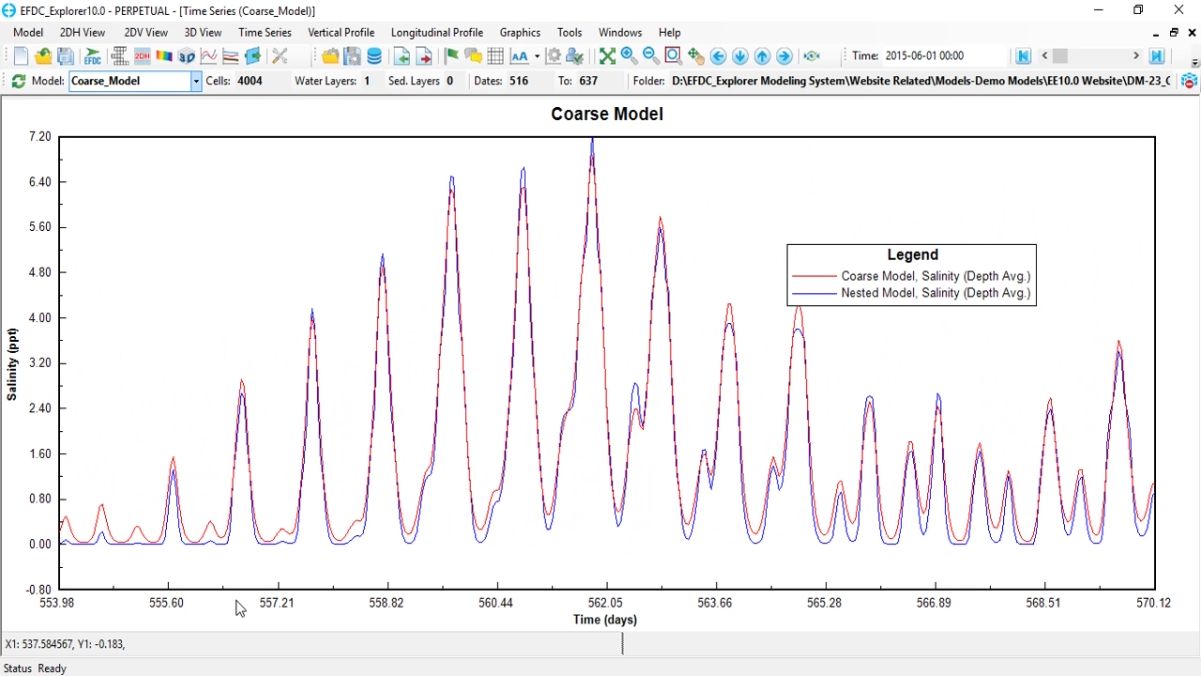
Figure 5 Compare Salinity result between two models.
...