...
...
...
...
...
...
...
...
...
...
...
...
...
...
...
...
...
The flux comparison tool is provided to assist the user in calibration mass flux or flow across a user defined line. From Model Control form, the Vertical Profile sub-tab contains the options that Define Calibration Series, View Time Series Plots and Calculation Error Statistics so user may Calculate Error Statistics. The user must first configure these comparisons with the Define Calibration Series option which displays the form as is described below.
Flux Transects Comparisons Definition
The form used to configure the flux transects definitions is shown in Figure 1. This form provides the user with options of defining the number of time series to be compare compared in the # of Comps text box in the top left corner. The user should define an ID (usually a station name), and set the path to the predefined flux line as well as the data file corresponding to that flux line. Note that the key CTRL+H can be used to search and replace text in the case where the path to the data files is incorrect.
The following five columns are used to set the Parameter (based on the parameter codes shown in Figure 3). The Filter column is used to filter the data with a moving average. The Mult column is used as multiplier and Use will activate or deactivate for these comparisons by checking or unchecking on the checkbox. User Users can configure these definition settings by directly type typing in the Flux Line Time Series Comparisons form table in Figure 1 or RMC on the cells to obtain the Station Information window to form to set input options as shown in Figure 2.
| Anchor | ||||
|---|---|---|---|---|
|
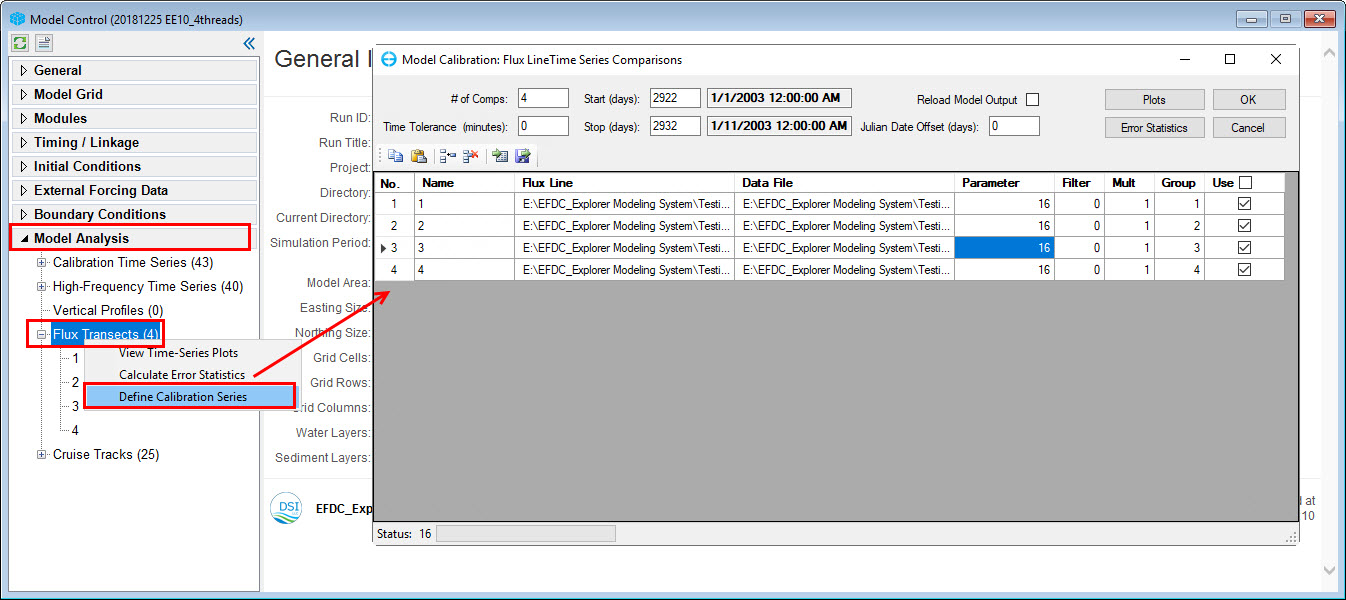
Figure 1 Flux Lines Time Series Comparisons main definition form.
Anchor Figure 2 Figure 2
...
Anchor Figure 3 Figure 3
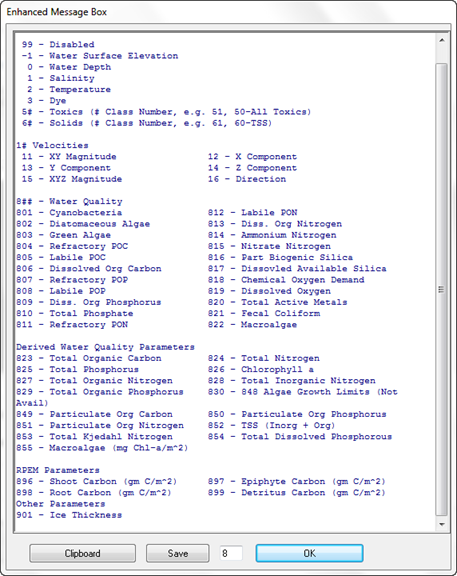
Figure 3 Available calibration Calibration parameter codes.
Flux Transects Comparisons Plot
The following graphic shows the toolbar functions avaialbe when the user selects Plot . These functions are the same as time series calibration plot functions.

An example of Flux Transects Comparison plot is shown in Figure 4.
Anchor Figure 4 Figure 4
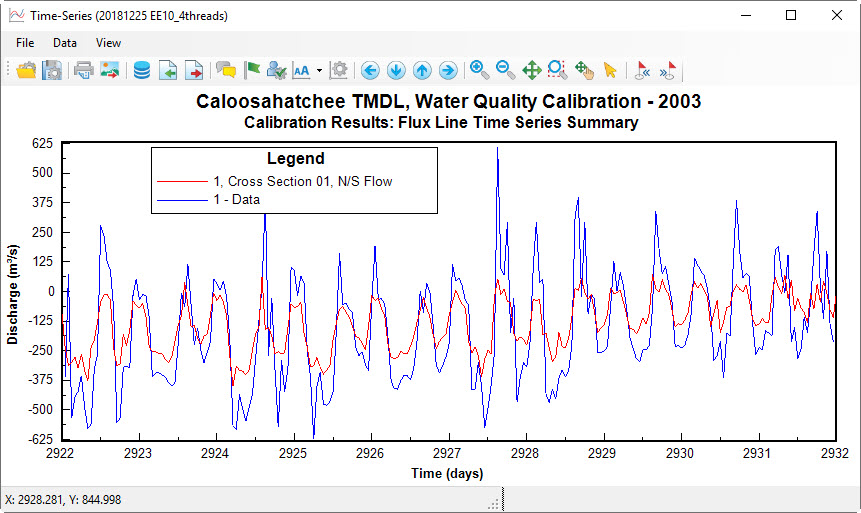
Figure 4 An example of flux transect comparison - flow discharge.
...