...
To demonstrate the netCDF output is consistent with the data viewed in EE, a number of comparisons have been made for different models. Examples of a output from the West Lake WQ model in EE, ArcGIS and ncWMS are shown in Figure 20, Figure 21 and Figure 22 respectively. Note that the West Lake model may be downloaded from the EE website.
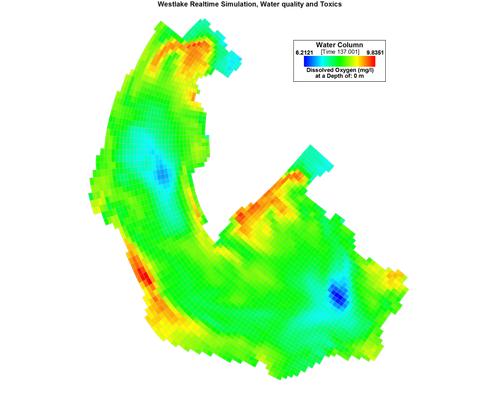
Figure 20 EE display of EFDC+ output – DO at 137.001
...