A recent feature of EFDC_Explorer is the ability to plot correlations between the model and existing data to assist the user in calibration. The method for setting up correlation plots is similar to that for Model-Data Configuration in Time Series Comparisons The setting up of linkages is the same as that for Time Series Comparisons, however, with Correlation Plots the user is able to select which error statistics will be displayed on the plot, as shown in Figure 1.
| Anchor | ||||
|---|---|---|---|---|
|

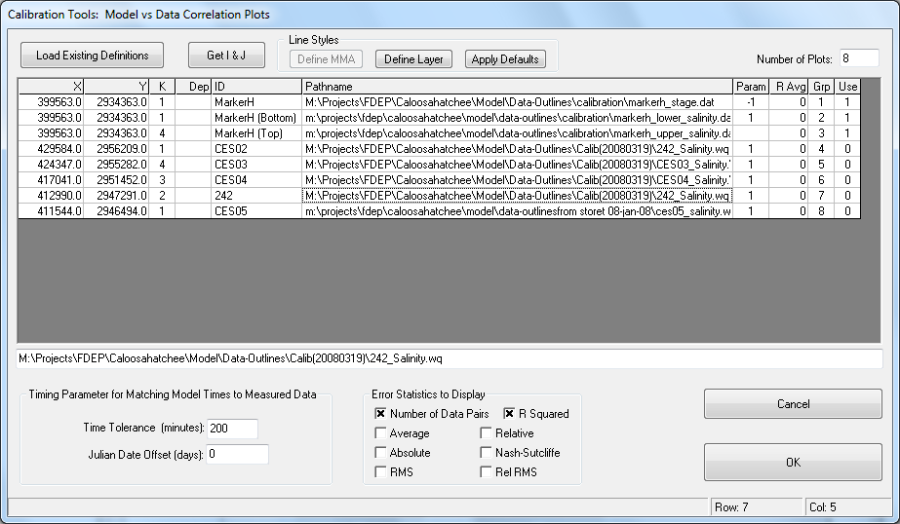
Figure 1 Calibration tool: Model vs Data Correlation Plots.
...