A Taylor Diagram is a way of graphically summarizinghow closely model results match observations. The details of the diagram can be found at Taylor diagrams (Taylor, 2001). This feature is accessed from the Tools menu as described below.
...
To use this option, click the Tools menu then select Taylor Diagram as shown in Figure 2, then the Taylor Statistics form will be displayed as shown in Figure 3. From this form select Data from the drop-down list for Base Series, then click the Calculate button to update the statistics table. Finally, click the OK button to display the plot shown in Figure 4. This diagram uses three red points to represent the two models and the observed data. From this, we can see that the red point representing the simulated results of Model 2 is closer to the observed data than Model 1. Therefore Model 2 demonstrates better performance.
Anchor Figure 2 Figure 2
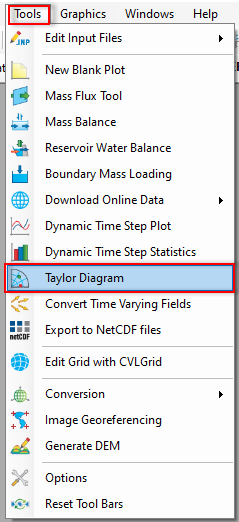
Figure 2. Taylor Diagram option.
Anchor Figure 3 Figure 3
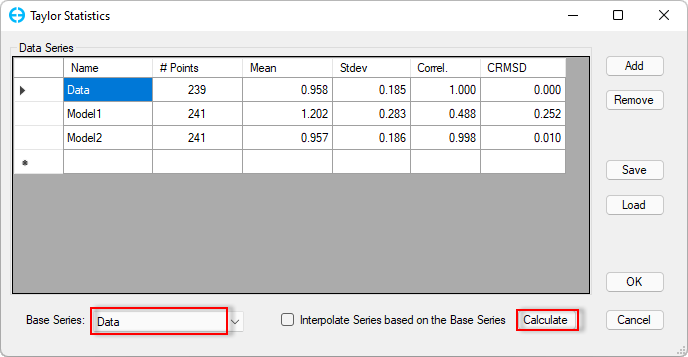
Figure 3. Taylor Statistics form.
Anchor Figure 4 Figure 4
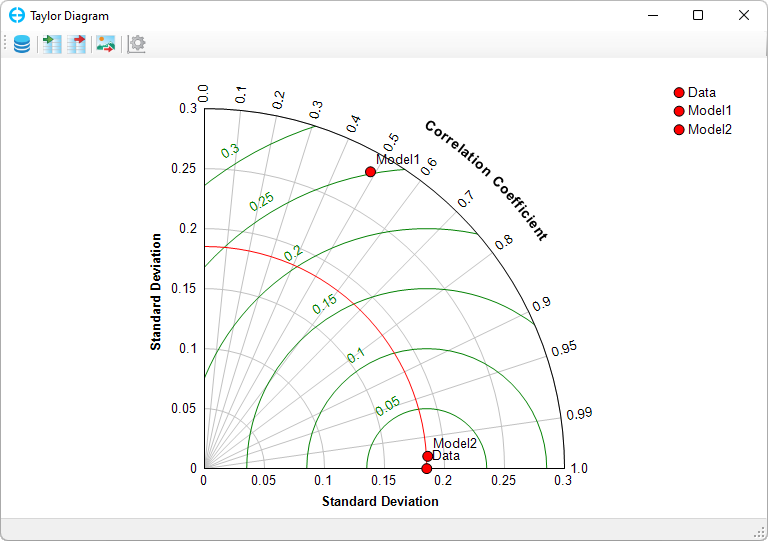
Figure 4. Taylor Diagram.
...
Taylor Diagram
...
.
Export the Taylor statistics to a file (*.taylor) by clicking on the Export Taylor statistics button on the top toolbar as shown in Figure 5. This file can be imported later by clicking the Import Taylor statistics as shown in Figure 6. The user should browse to the file (*.taylor) then click the Open button.
The Taylor diagram can be exported to an image file (*.png or *.jpg) using the button shown in Figure 7. Line style and fonts for elements of the Taylor diagram may also be adjusted using the button shown in Figure 8.
Anchor Figure 5 Figure 5
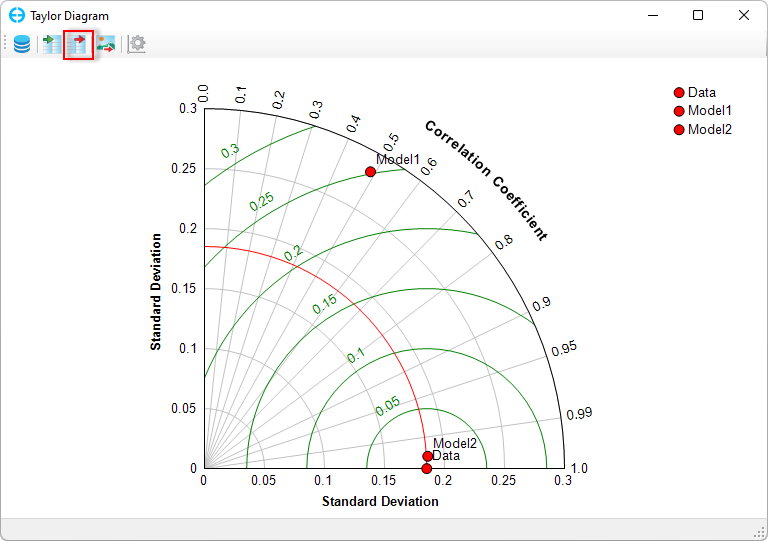
Figure 5. Export Taylor statistics.
Anchor Figure 6 Figure 6
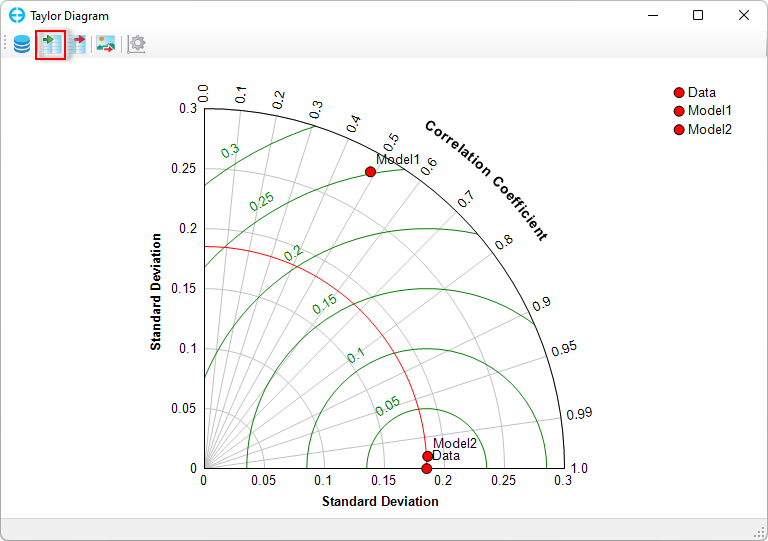
Figure 6. Import Taylor statistics.
Anchor Figure 7 Figure 7
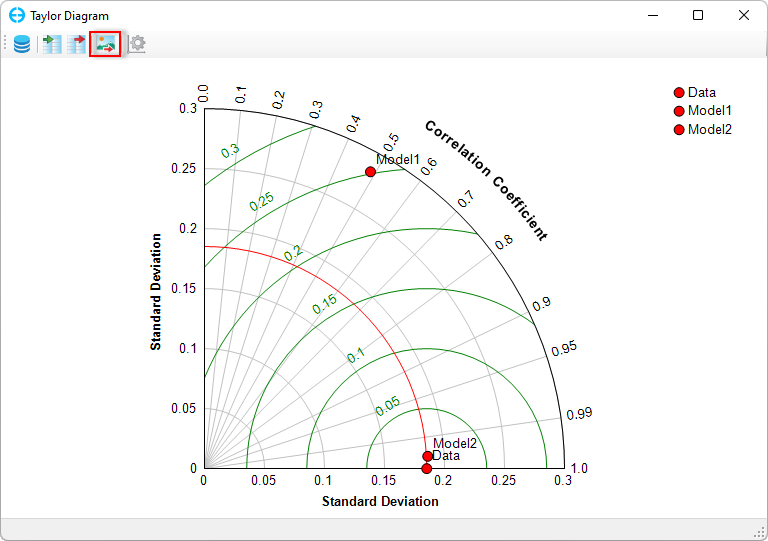
Figure 7. Export Taylor Diagram.
Anchor Figure 8 Figure 8
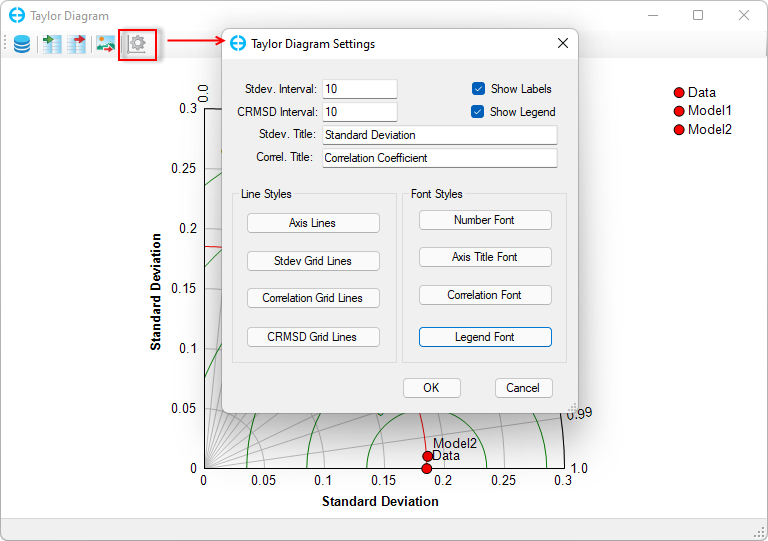
Figure 8. Taylor Diagram Settings.