...
| Anchor | ||||
|---|---|---|---|---|
|
Figure 1. WASP Linkage Output Setting from EE.
...
| Anchor | ||||
|---|---|---|---|---|
|
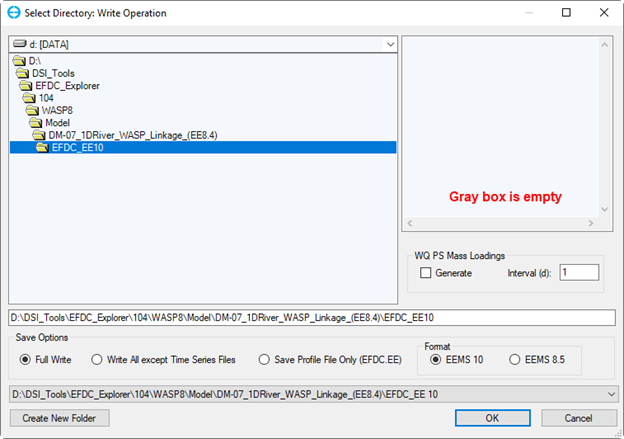
Figure 3. Saving the model.
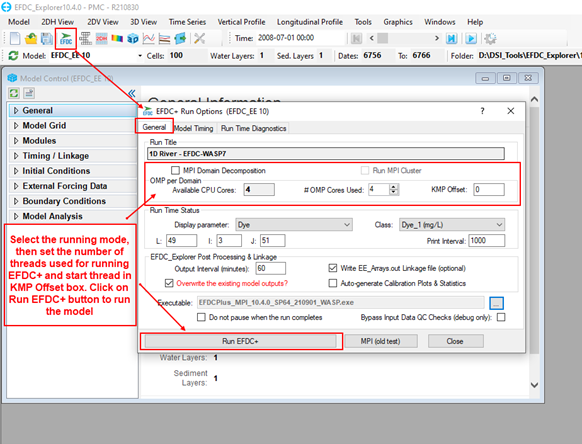
To run the model, follow the steps below, as shown in 2085912617.
...
| Anchor | ||||
|---|---|---|---|---|
|
Figure 4. EFDC+ Run Options form.
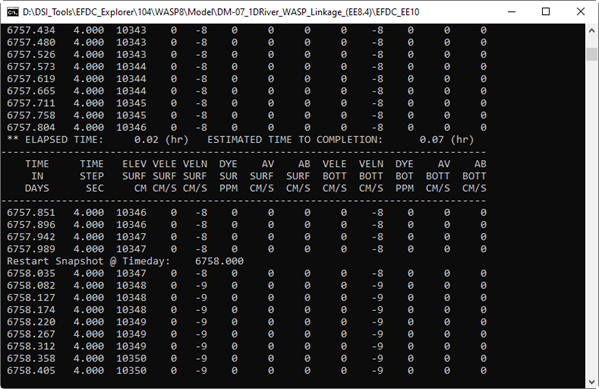
Click on the Run EFDC+ button to start running the model. A run window such as that pictured in 2085912617 will appear.
| Anchor | ||||
|---|---|---|---|---|
|
Figure 5. EFDC+ run window.
After the EFDC+ model run is finished, the user should browse to the output folder to make sure that the efdc_dsi_wasp.hyd file has been generated. It should be noted that the WASP8SEG_EFDCIJK.DAT file allows the identification of the corresponding segment between the WASP and the EFDC cell.
...
| Anchor | ||||
|---|---|---|---|---|
|
Figure 6. WASP Linkage file generated by EFDC+.
...
| Anchor | ||||
|---|---|---|---|---|
|
Figure 7. Create a new WASP project.
...
| Anchor | ||||
|---|---|---|---|---|
|
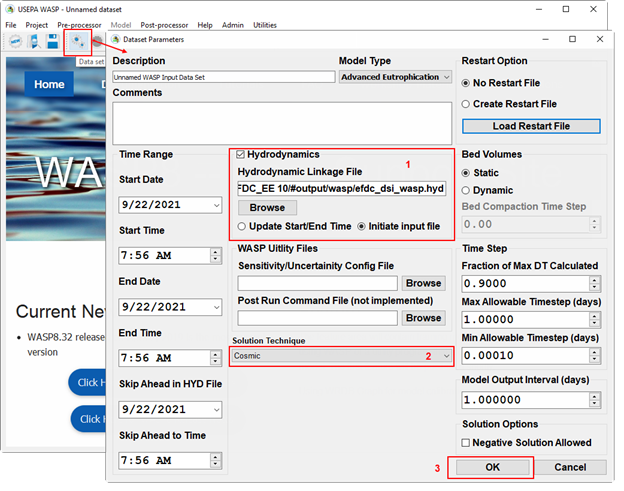
Figure 8. Link hydrodynamics output from EFDC+ to WASP model.
...
| Anchor | ||||
|---|---|---|---|---|
|
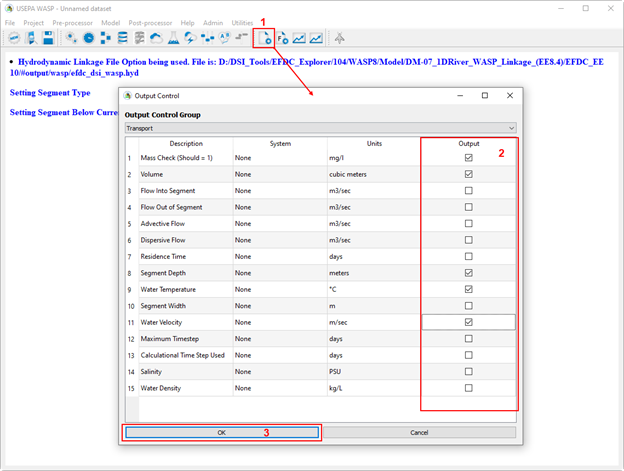
Figure 9. Select WASP output parameter to write out.
...
| Anchor | ||||
|---|---|---|---|---|
|
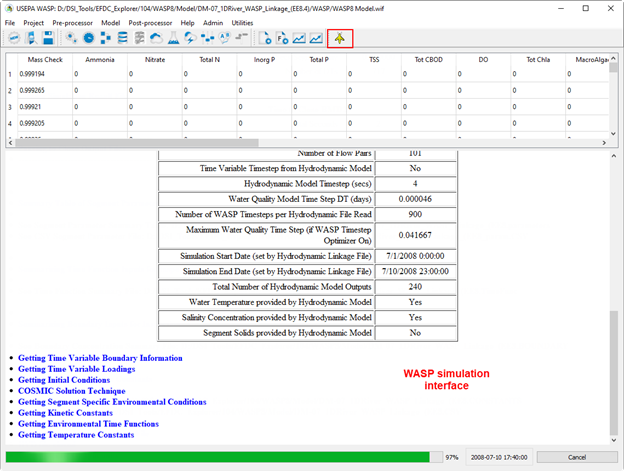
Figure 11. WASP model run interface.
...
| Anchor | ||||
|---|---|---|---|---|
|
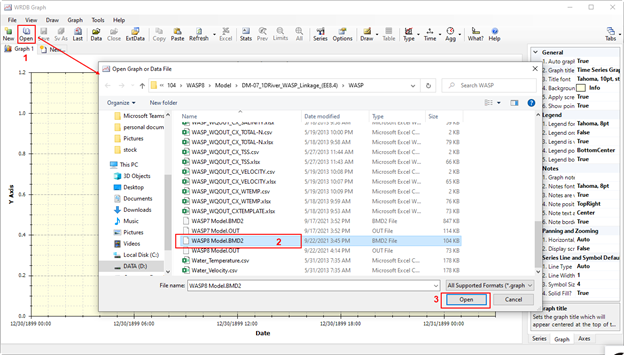
Figure 12. Open WASP output from WRDB Graph.
...
| Anchor | ||||
|---|---|---|---|---|
|
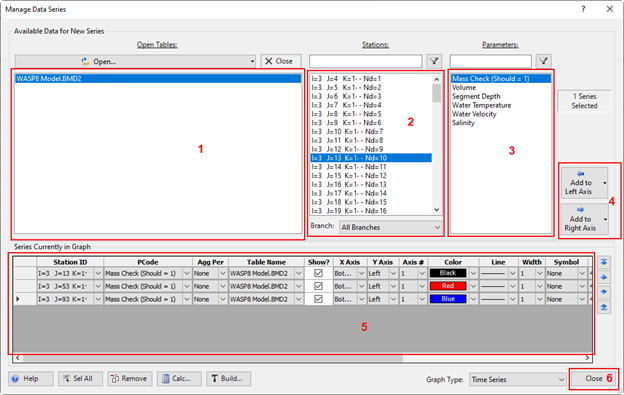
Figure 13. Manage data series to plot.
...
| Anchor | ||||
|---|---|---|---|---|
|
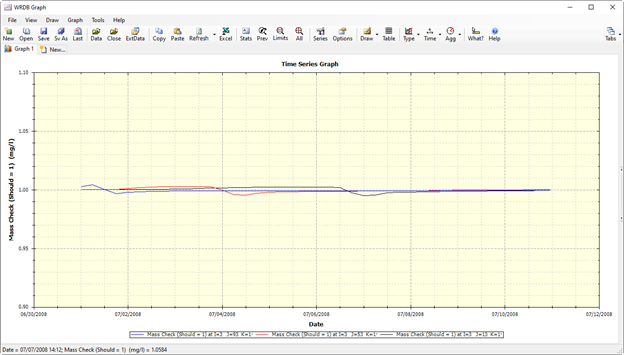
Figure 14. Data series plotted by WRDB Graph.
...
| Anchor | ||||
|---|---|---|---|---|
|
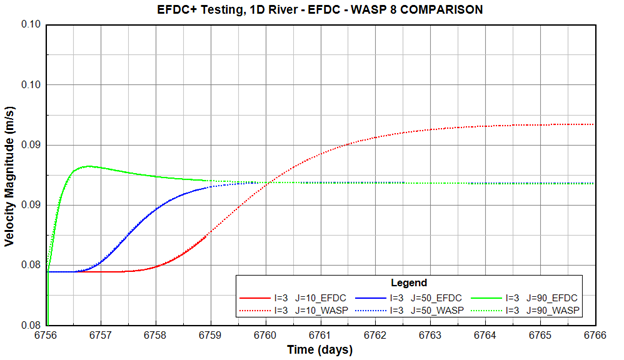
Figure 15. EFDC+ and WASP 8 velocity Comparison.
...
| Anchor | ||||
|---|---|---|---|---|
|
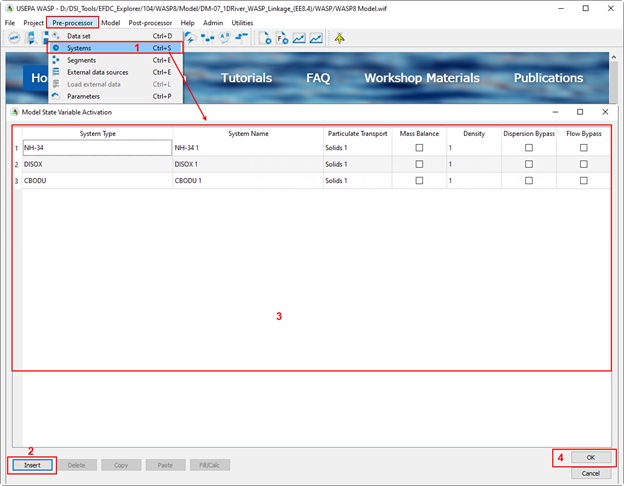
Figure 16. Add water quality constituents to the WASP model.
...
| Anchor | ||||
|---|---|---|---|---|
|
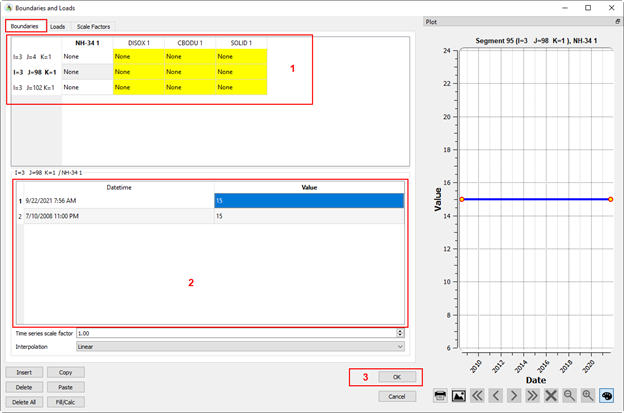
Figure 17. Add water quality boundary conditions to WASP model.
...
| Anchor | ||||
|---|---|---|---|---|
|
Figure 18. Add water quality boundary conditions data series.
...
| Anchor | ||||
|---|---|---|---|---|
|
Figure 19. Set model parameters and kinetic coefficients.
...
| Anchor | ||||
|---|---|---|---|---|
|
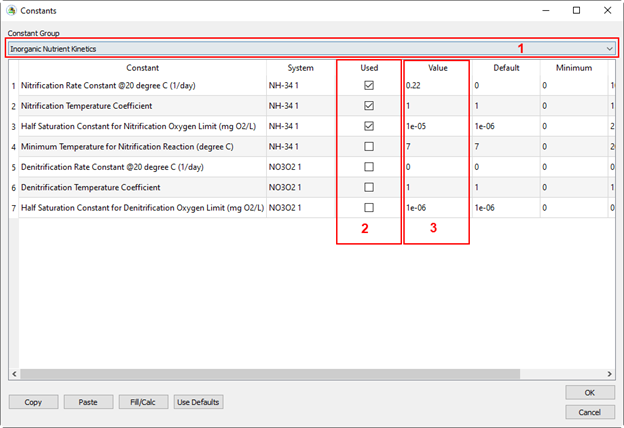
Figure 20. Set Inorganic Nutrient kinetics parameters.
...
| Anchor | ||||
|---|---|---|---|---|
|
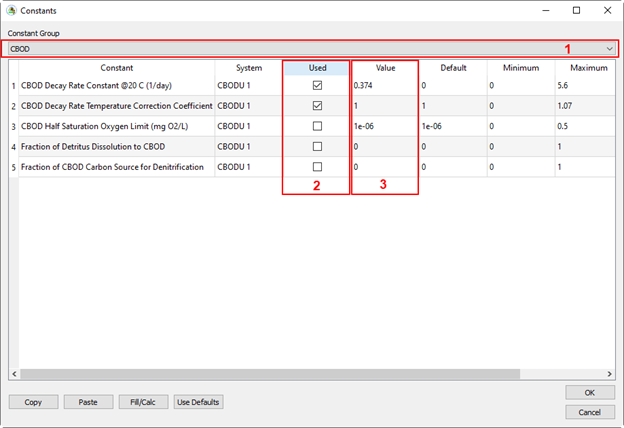
Figure 21. Set CBOD parameters.
| Anchor | ||||
|---|---|---|---|---|
|
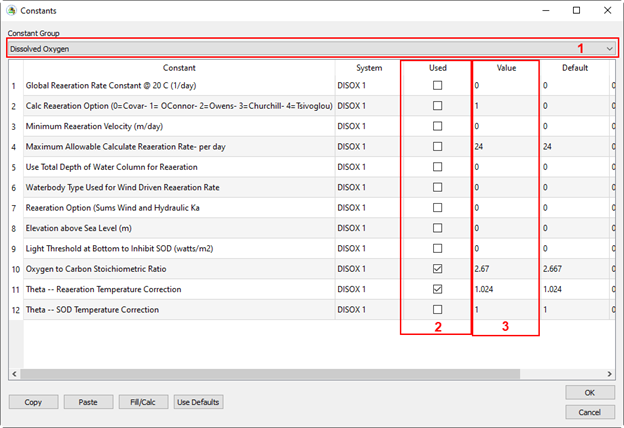
Figure 22. Set dissolved oxygen parameters.
...
| Anchor | ||||
|---|---|---|---|---|
|
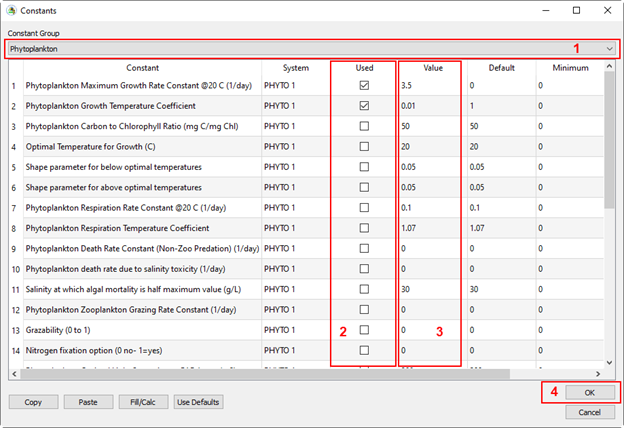
Figure 23. Set Phytoplankton parameters.
...
| Anchor | ||||
|---|---|---|---|---|
|
Figure 24. Set Output Control.
From the Output Control form,
...
| Anchor | ||||
|---|---|---|---|---|
|
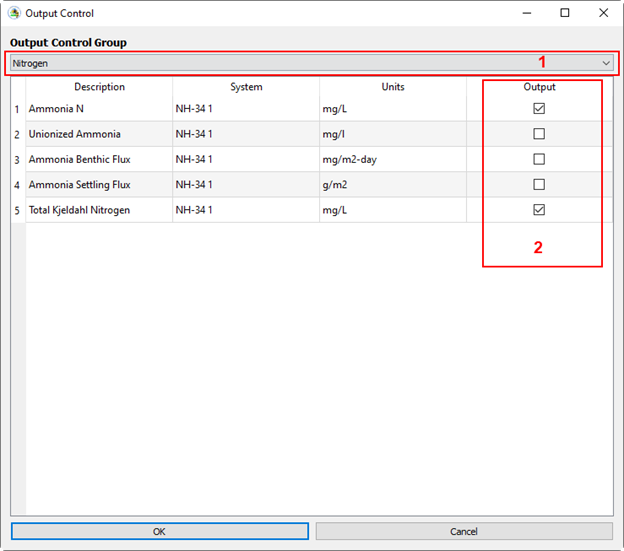
Figure 25. Add Nitrogen parameters to the output.
...
| Anchor | ||||
|---|---|---|---|---|
|
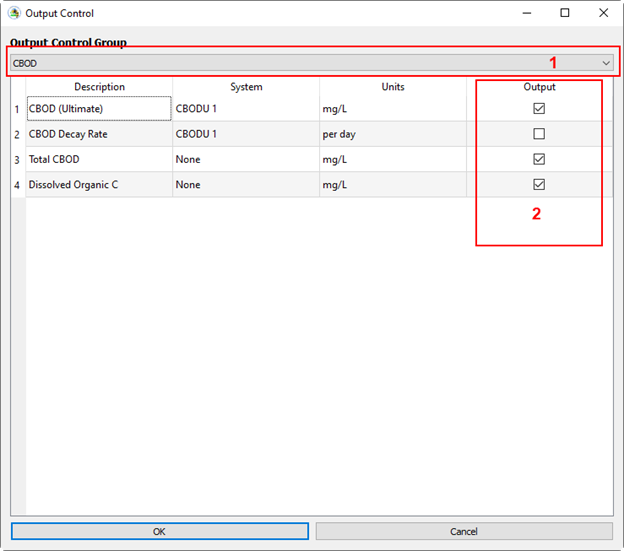
Figure 26. Add CBOD parameters to the output.
...
| Anchor | ||||
|---|---|---|---|---|
|
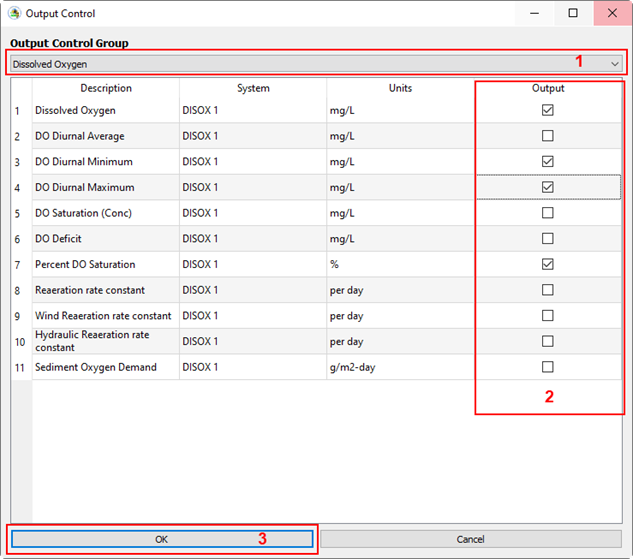
Figure 27. Add DO parameters to the output.
...
| Anchor | ||||
|---|---|---|---|---|
|
Figure 28. Save and run WASP model.
Visualize WASP Output
...
| Anchor | ||||
|---|---|---|---|---|
|
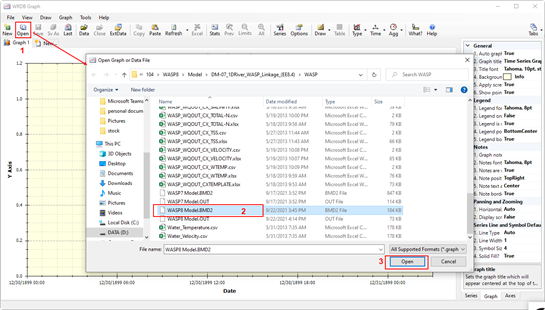
Figure 29. Open WASP output from WRDB Graph.
...
| Anchor | ||||
|---|---|---|---|---|
|
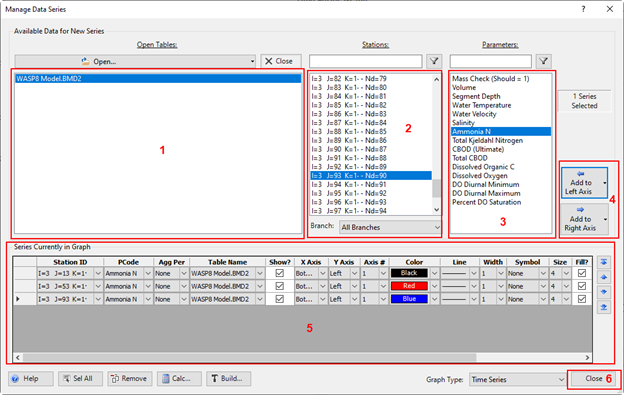
Figure 30. Manage data series to plot.
...
| Anchor | ||||
|---|---|---|---|---|
|
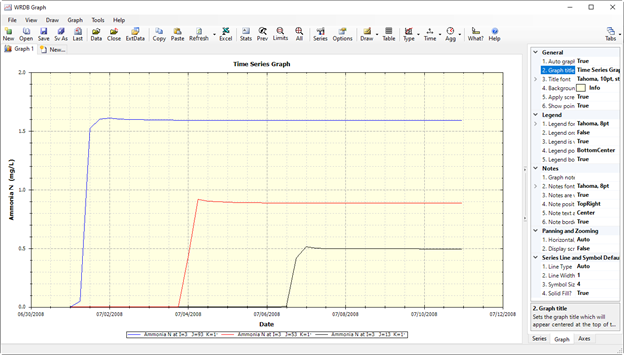
Figure 31. Data series plotted by WRDB Graph.
...
| Anchor | ||||
|---|---|---|---|---|
|
Figure 32. Graph type of WRDB Graph.
...
| Anchor | ||||
|---|---|---|---|---|
|
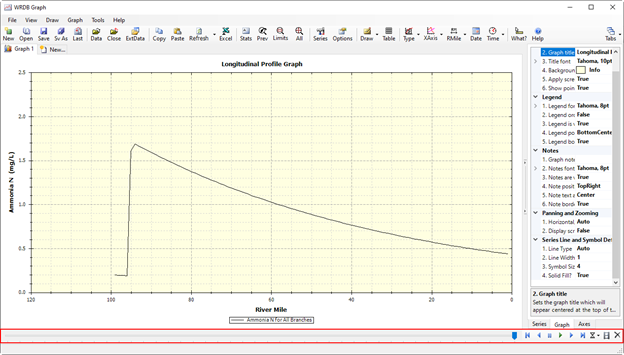
Figure 33. Timing bar in Longitudinal Profile Graph.
...
| Anchor | ||||
|---|---|---|---|---|
|
Figure 34. Time series comparison of water temperature between EFDC+ and WASP output.
...
| Anchor | ||||
|---|---|---|---|---|
|
Figure 35. Time series comparison of DO between EFDC+ and WASP output.
...
| Anchor | ||||
|---|---|---|---|---|
|
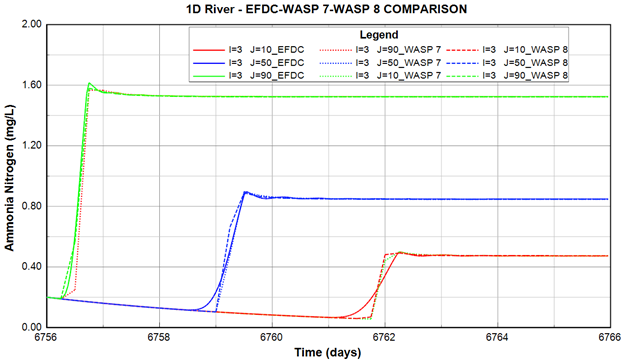
Figure 36. Time series comparison of NH3-N between EFDC+ and WASP output.
...
| Anchor | ||||
|---|---|---|---|---|
|
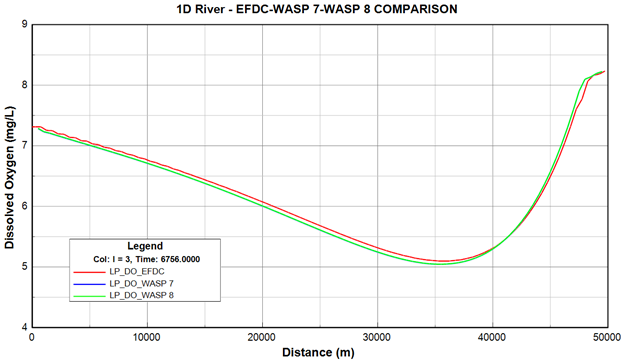
Figure 37. Longitudinal profile comparison of DO between EFDC+ and WASP output.
...
| Anchor | ||||
|---|---|---|---|---|
|
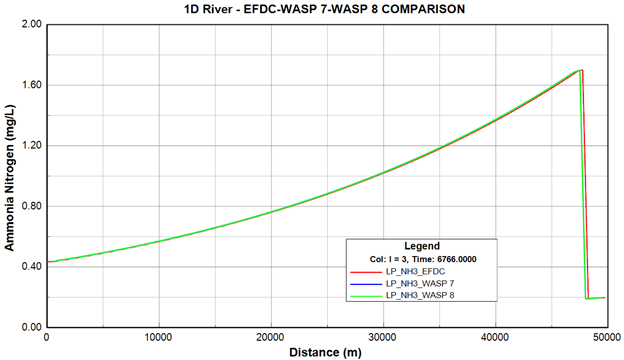
Figure 38. Longitudinal profile comparison of NH3-N between EFDC+ and WASP output.
...

