1. Introduction
...
3. In Grid Tool, select Import Grid from Files and the Import Grid button will become available. After clicking on Import Grid, a new form appear (Figure 3). The user should choose the Grid Type according to the data files (RGF Grid or CVL Grid) and then click on Browse to browse to the "EFDC_Grid" data file (available from the EEMS website)
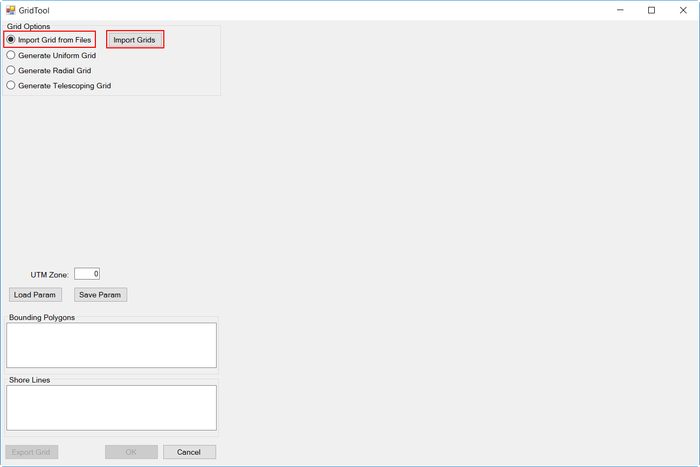
Figure 2 2. Generate EFDC Model and Import Grid Form.
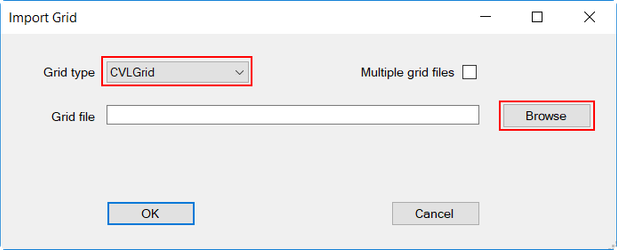
Figure 3 3. Browsing for grid file.
4. Click OK button to finish grid creation.
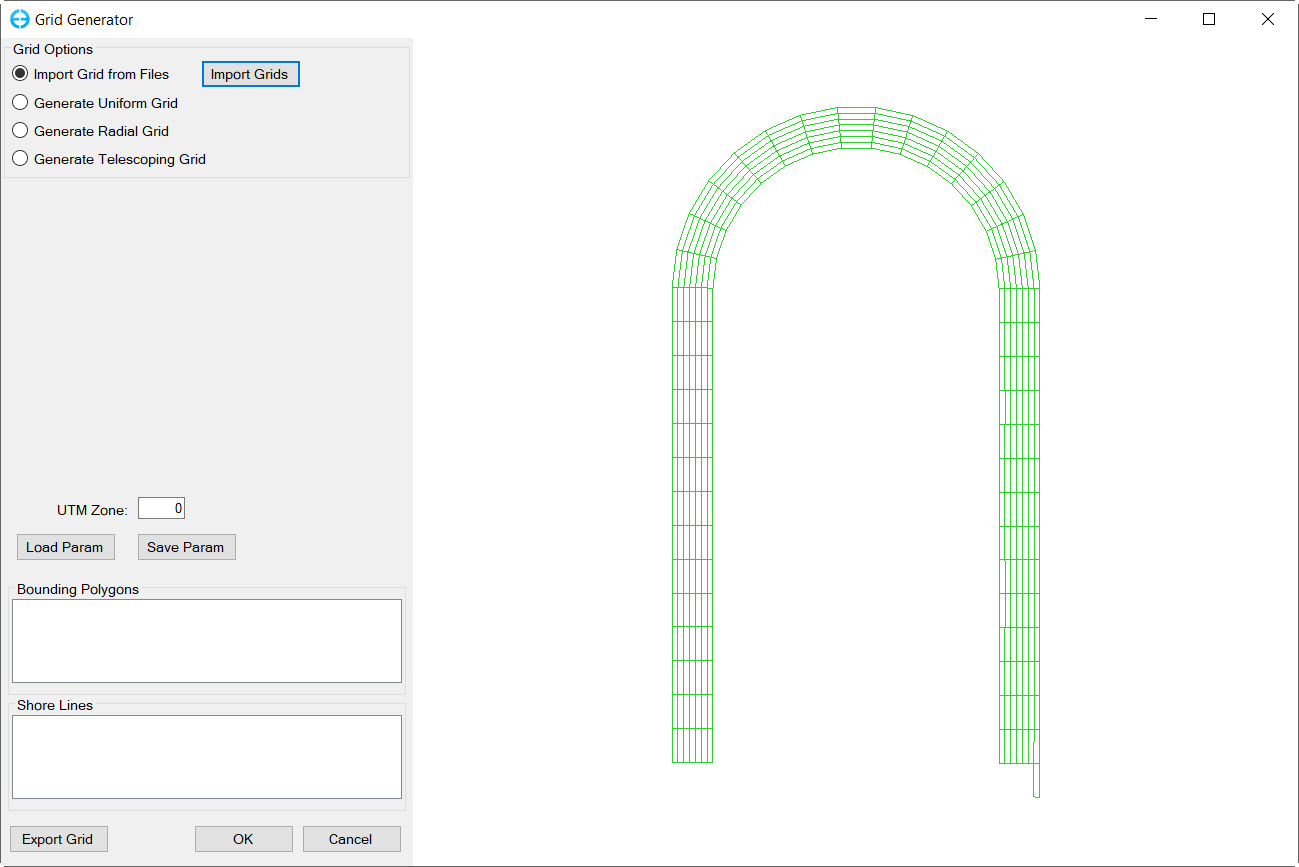
Figure 4 4. Created grid.
5. Save the model by selecting this button ![]() and create a new directory
and create a new directory
...
2. In Layer Control, select the Edit icon under Bottom Elevation
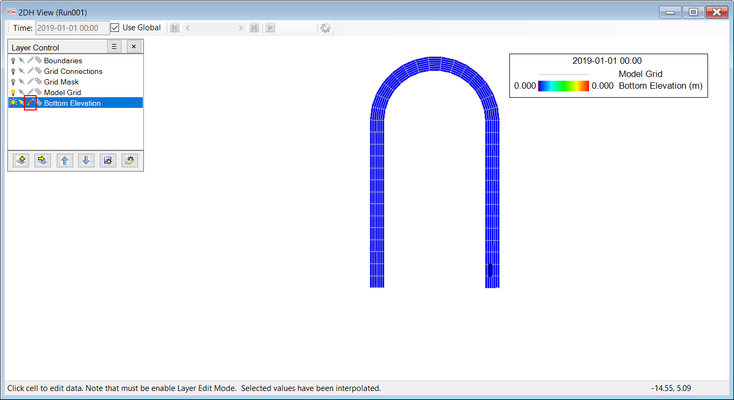
Figure 5 5. Edit bottom elevation.
3. In the main control, click on Grid Cell Tools to open a drop-down list, then select Set IJ Slopes
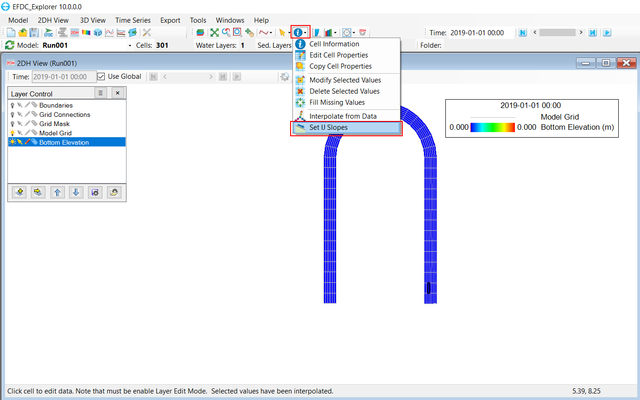
Figure 6 6. Grid Cell Tools.
3. The Assign Slope form should appear, the user input Start Value and I Slope as in Figure 7 then click OK
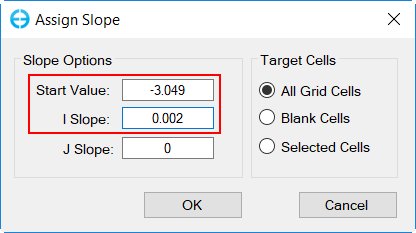
Figure 7 7. Assign Slope Value
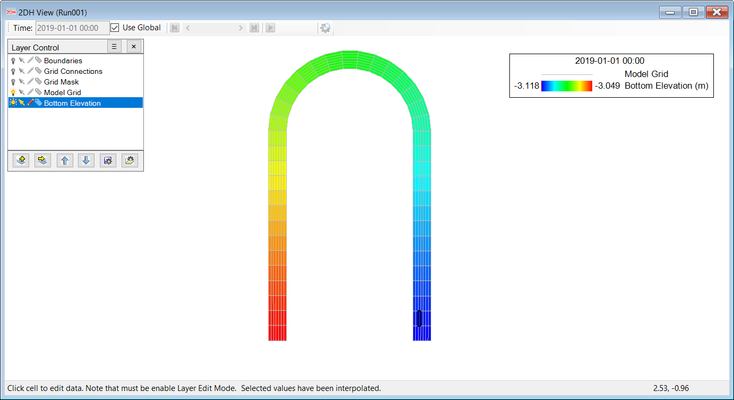
Figure 8. Channel Slope View
3.2 Assigning the Depth/Water Surface Elevations
...
2. A new Water Depth/ Surface Elevations form appear, the user select Assign Depth. The window in Figure 9 will pop up.
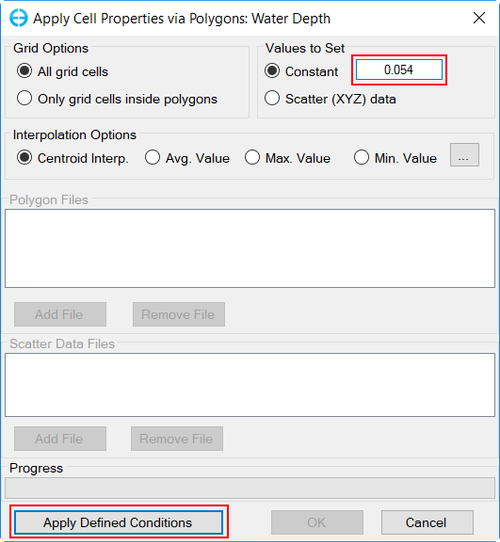
Figure 9 9. Assigning Water Depth.
3. Select Constant and enter the value 0.054. click to the Apply Defined Conditions button to make your changes take effect before selecting the OK button.
...
5. Select Wetting and Drying tab, change the value for Wet Depth to 0.01 and the value of Dry Depth to 0.0011 (dry depth must always smaller than wet depth and larger than minimum depth)
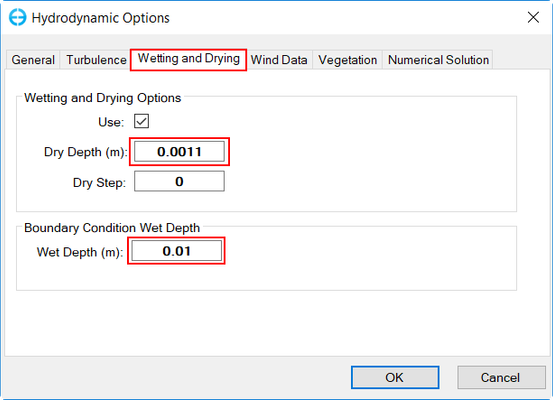
Figure 10 10. Change Dry Depth and Wet Depth.
...
4. Give a Title for associated time series.
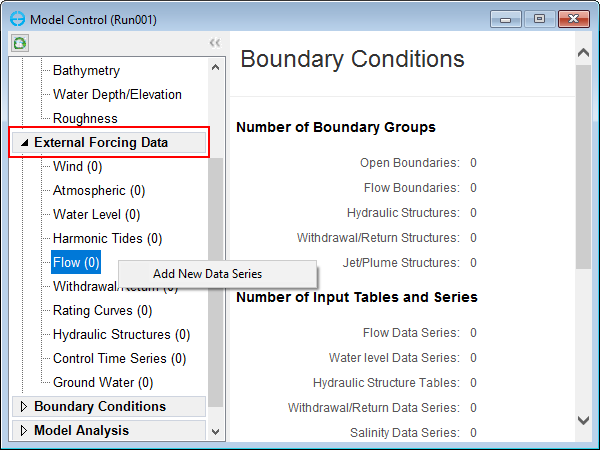
Figure 11. Assigning Flow Boundary Conditions.
...
5. The user input data series as in Figure 12
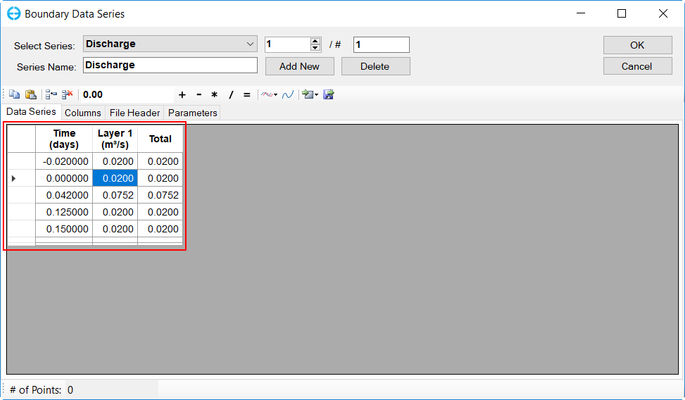
Figure 12 12. Entering the Boundary Time Series
...
3. Copy and Paste the time series data into the work-space as shown in Figure 12
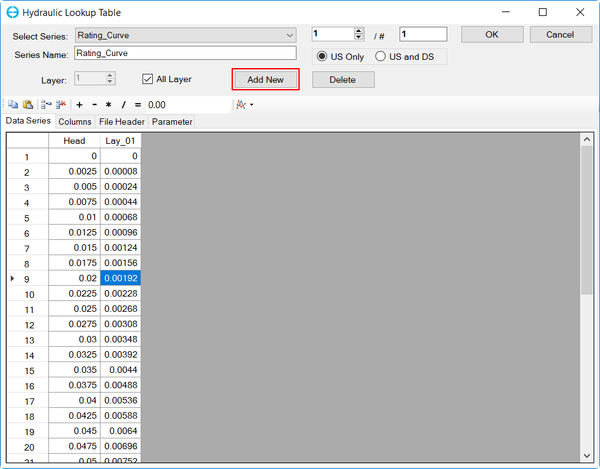
Figure 13 . Editing the Rating Curve Time Series
...
| Info |
|---|
If the pasted data appear to be rounded up or down in EE, the user can go into Columns tab and change the Format to F6 |
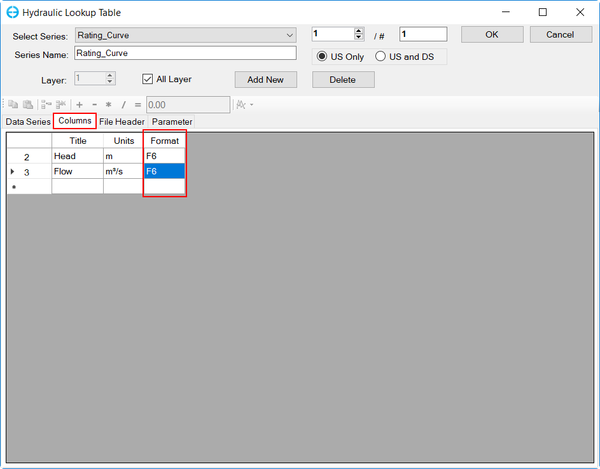
Figure 14. Changing format for data series
...
4. Click the ![]() View Series button to view the current time series. Click OK to finish
View Series button to view the current time series. Click OK to finish
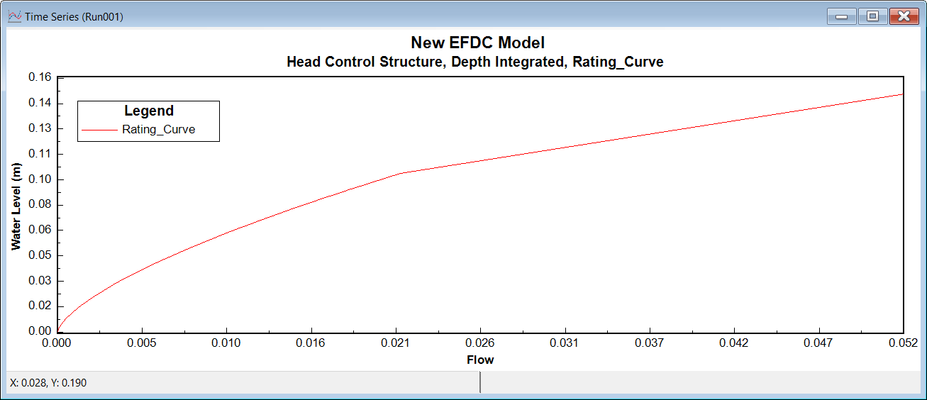
Figure 15 15. Plot of Rating Curve.
4.3 Assigning Time Series to the Boundary Location Cells.
...
3. Enable Edit grid by turn on icon ![]()
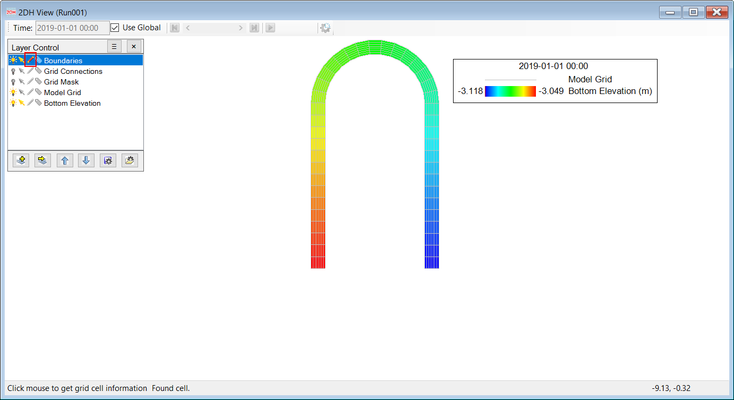
Figure 16 16. Edit boundary condition
4. Hold "SHIFT" and LMC to select all the upstream cell
5. Right mouse-click and select Add New Boundary Group
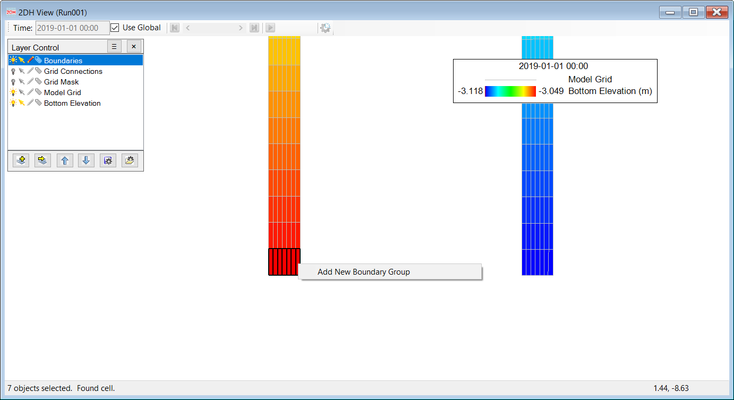
Figure 17 17. Assign Upstream Boundary Condition to Cells.
...
7. Select Boundary Group Type. It is dependent on your current boundary type to choose the suitable boundary type. In this case, choose Flow Boundary and click OK
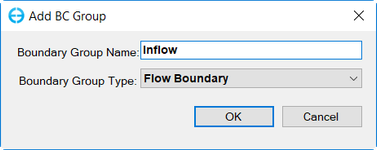
Figure 18 . Enter Boundary Group ID and Type.
...
8. In the new Flow Boundary Conditions form, select the flow table associated with this inflow boundary time series from the Flow table drop-down list
9. Select All to apply to all selected boundary cells. Click on Dist Factor to distribute flow to all boundary cells.
10. Click OK to finish
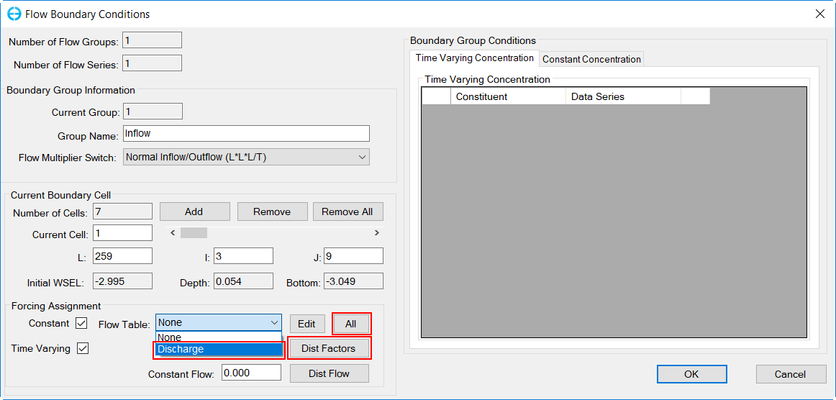
Figure 19 . Assign the corresponding time series.
...
1. Still in 2DH View with Edit Boundary ![]() selected, hold "SHIFT" and LMC to select all the downstream cell and RMC to select Add New Boundary Group
selected, hold "SHIFT" and LMC to select all the downstream cell and RMC to select Add New Boundary Group
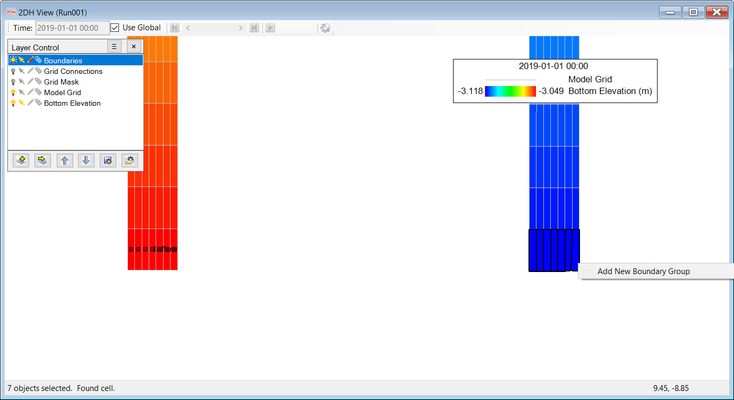
Figure 20 Assign 20. Assign Downstream Boundary Condition to Cells.
...
3. Select Boundary Group Type: Hydraulic Structure/ Rating Curve and click OK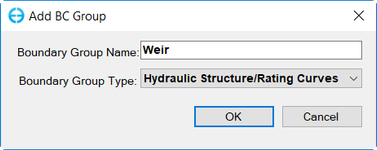
Figure 21 21. Enter Downstream Boundary Group ID and Type.
...
4. In the new Hydraulic Structure Boundary Conditions form, select the rating curve data series from the Rating Table drop-down list
5. Select All to apply to all selected boundary cells
6. Click OK to finish
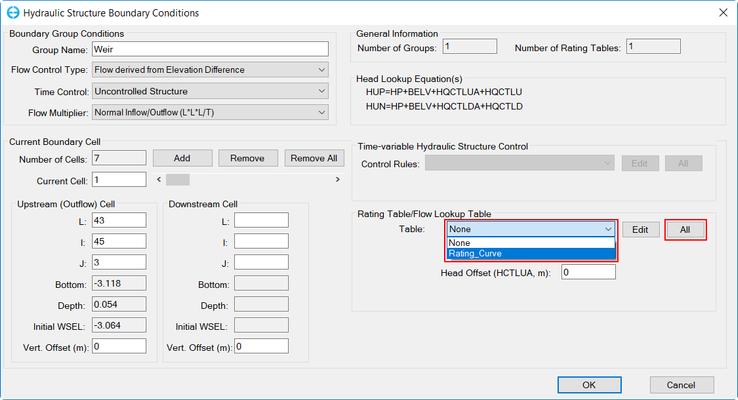
Figure 22 22. Hydraulic Structure Boundary Conditions.
...
2. The user click on (SEDZLJ) Sediments to activate SEDZLJ sediment transport model
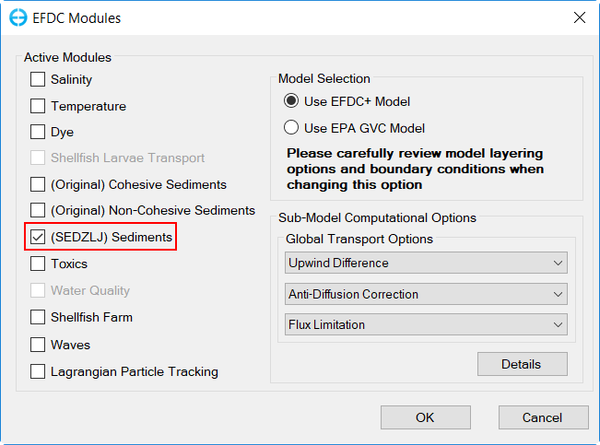
Figure 23 23. Active Sediments Module.
3. Click OK to finish and a new Sediment tab will appear under Modules
4. RMC on Sediment tab and select Settings
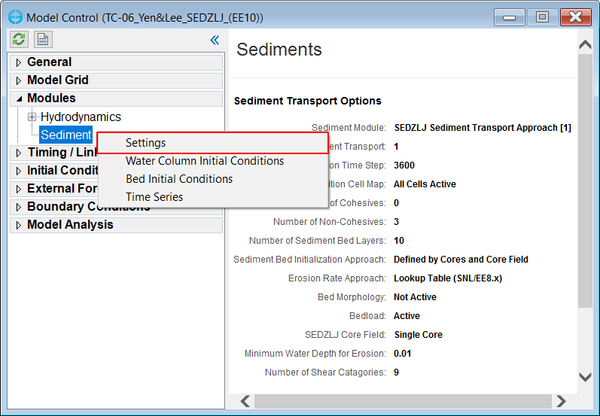
Figure 24 24. Modify Sediments Setting.
...
| Info |
|---|
In this section, we use "Lookup Table and Bed Properties be Core ID" .For other options, go to LINK |
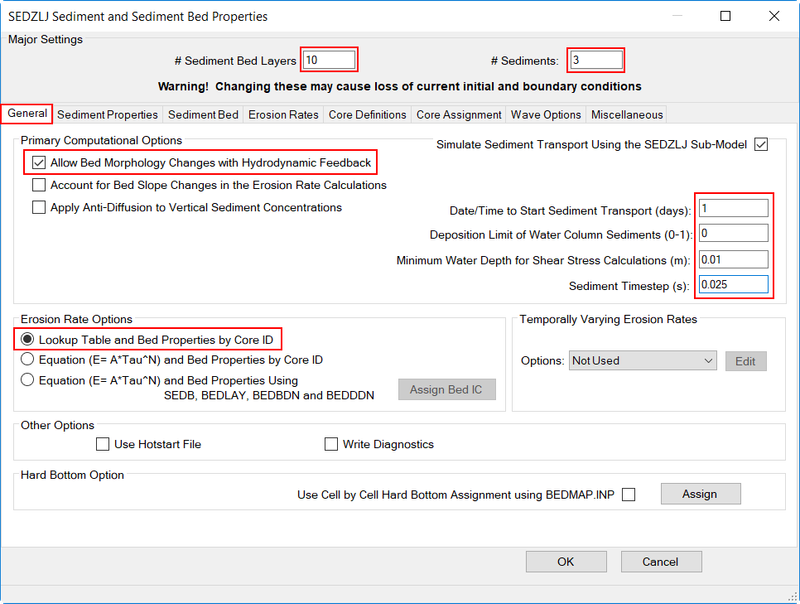
Figure 25 25. General setting of Sediment and Sediment Bed Properties.
...
6. Set up the Sediment Properties tab as Figure 26
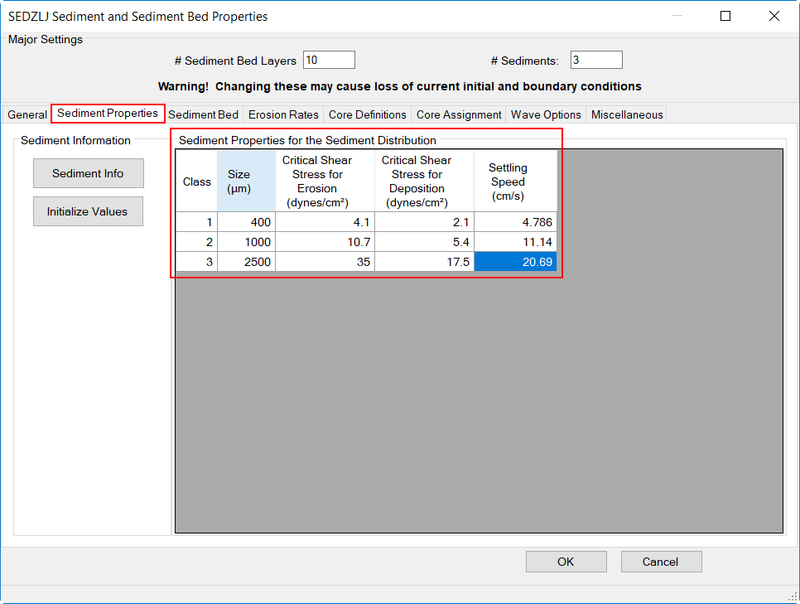
Figure 26. Setting Sediment Properties.
...
7. Set up the Sediment Bed tab as Figure 27.
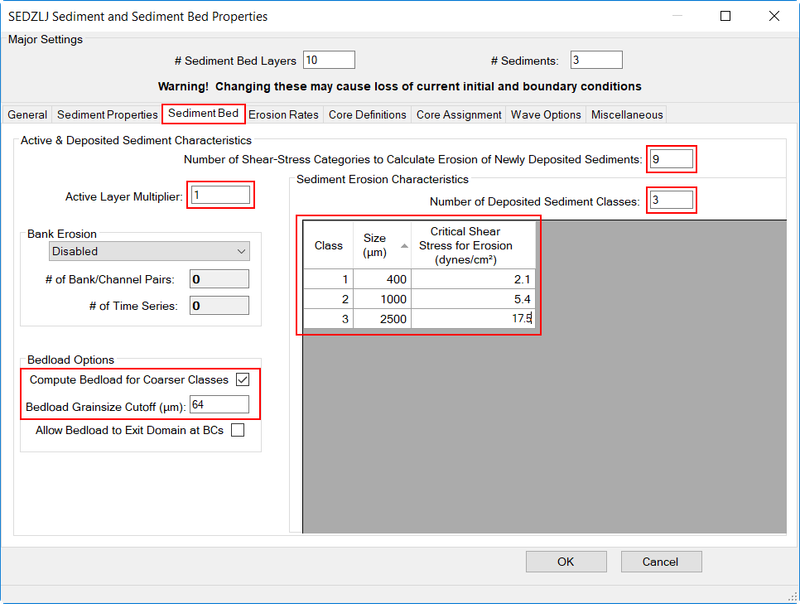
Figure 27 27. Setting Sediment Bed.
8.Set up Core Definitions tab as Figure 28
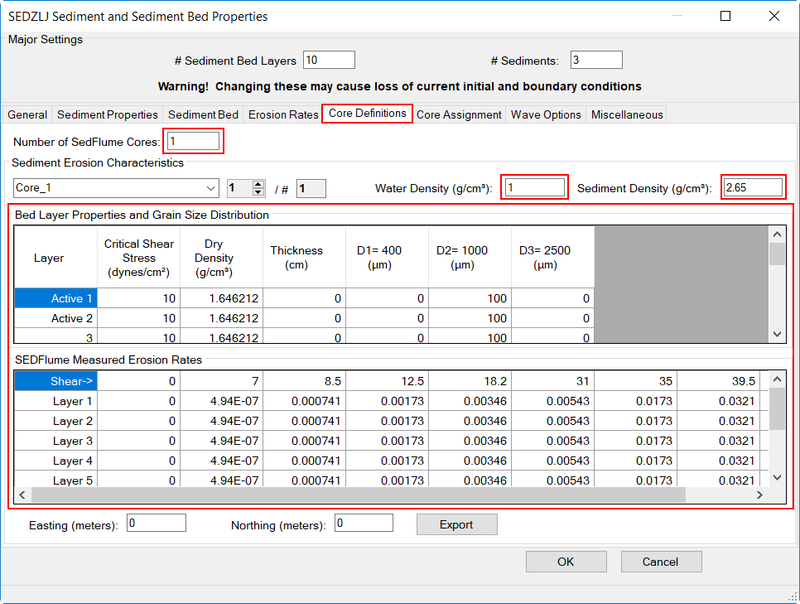
Figure 28 28. Setting Core Definitions.
...
9. Set up the Erosion Rates tab as Figure 29.
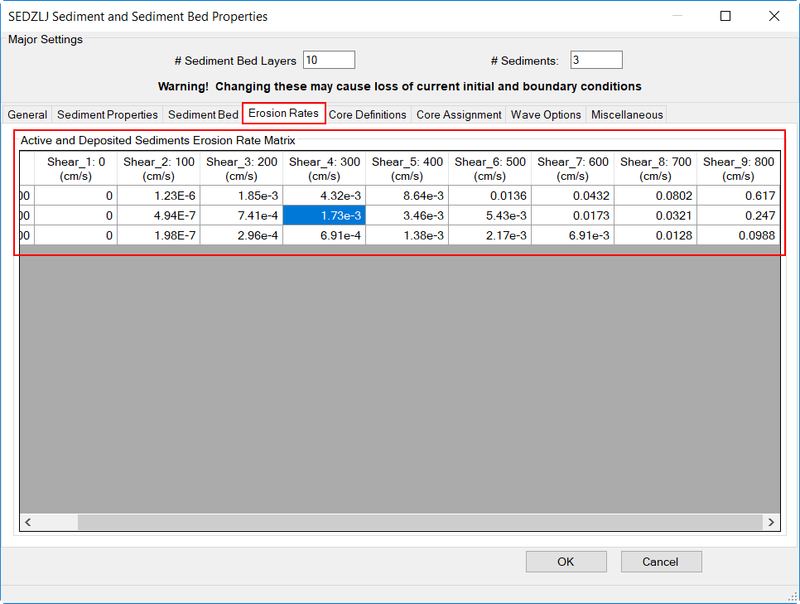
Figure 29 29. Setting Erosion Rates.
10.The remaining Core Assignment, Wave Options, Miscellaneous tabs does not require changes and should be ignored by the user. Click OK to finish and close the window.
...
Enter Duration of starting/ ending the simulation. Note that the boundaries time series should be always covered this simulation duration period. Otherwise, the model will not run
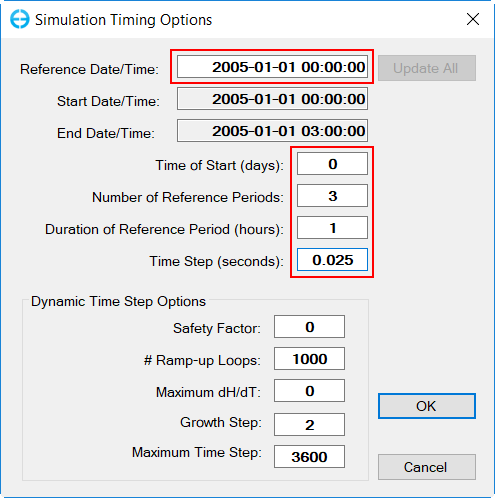
Figure 30. Model Run Timing.
7. Running EFDC
- Click Save Project button
 on the top of EE form to save the model again
 - Click Run EFDC button to run the model as shown in Figure 31
- Figure 32 shows EFDC+ running window.
Anchor #Figure 19 #Figure 19
| #Figure 19 | |
| #Figure 19 |
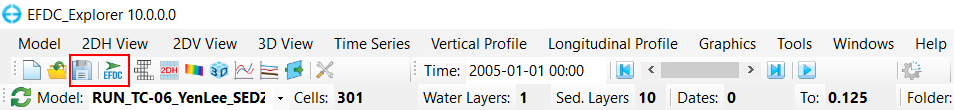
Figure 31 31. Save and Run Model.
Anchor #Figure 20 #Figure 20
| #Figure 20 | |
| #Figure 20 |

Figure 32 32. EFDC Sediment Model Running Window.
...