The Harmonic Analysis feature in the 2DH View menu is a post-processing utility that analyze analyzes the output water level of the model and evaluate evaluates harmonic constituents based on this output. Select Selecting Harmonic Analysis in the 2DH View menu will display the CoTidal Chart form as shown in Figure 1.
...
...
The constituents from the Available Constituents frame can be added to the Analyzing Constituents frame by the right arrow button  , or by
...
typing the names
...
in the Search box and
...
clicking on Search and Add Harmonic Constituents  , or using the
...
three shortcut buttons to quickly add the main 4, 8, or 11
...
constituents. Once finished adding constituents to be analyzed,
...
select OK.
| Anchor | ||||
|---|---|---|---|---|
|
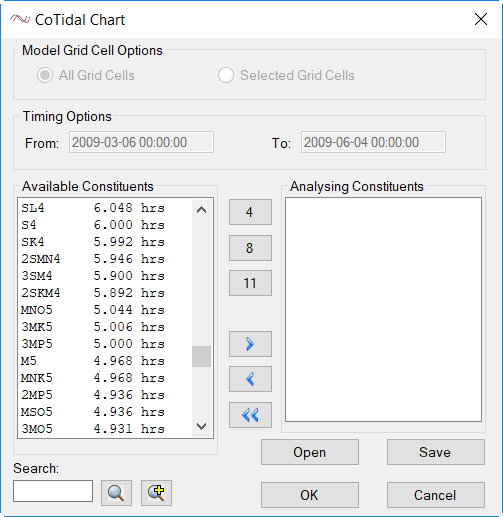
Figure 1. CoTidal Chart form.
Depending on the model's run time, it is possible for the water level output data length to not meet the required standard length and an error as shown in Figure 2 will appear then click OK button to close.
...
The user must reopen the form and remove the constituents mentioned in the error form (P1 and K1 in this case) with the left arrow button  then click OK to proceed. Once the analysis is finished, the user will detect a new Mean Level Level layer have been added in the Layer Control of 2DH View. RMC on this layer will allow the user to select between displaying the analyzed mean water level, the Root Mean Square Error (RMSE) of the analyzed water level compare to the output of the model, or the analyzed phases and amplitudes of analyzed constituents as shown in Figure 3.
...