The Calibration Time Series menu item provides several options using the RMC, including the options to configure the linkages with Define Calibration Series), plot data versus model with View Time-series Plot & View Correlation Plots, and generate a series of error measurements between model and data with Calculate Error Statistics. These options are described below.
...
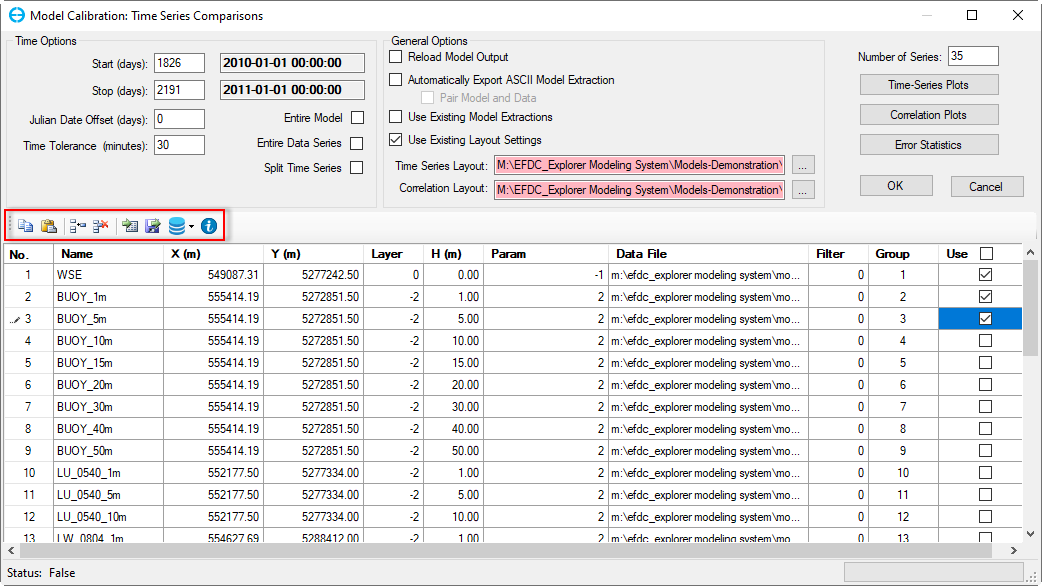
Figure 1 Time series calibration EFDC cell and data linkage definitions.
There are several options on top of the grid table in the Model Calibration form. They are described in the table below.
| Option | Description |
|---|---|
| This is the copy option. LMC on a cell in the table below. When that cell is highlighted click this option to copy that cell. |
| This is the paste option. After using the copy option, LMC on another cell, then select this option to paste the information to that cell. |
| This is the insert row option which allows inserting a new row into the grid table. Select a row by LMC on a cell of that row, then select this option will add a new row. |
| This is the delete row option which allows removing selected rows from the grid table. Select a row or multiple rows, then select this option will remove selected rows. |
| This is the import calibration data file option, which allows loading the calibration data file (*.EE). Select this option, the Import Calibration Data form will be displayed as shown in Figure 2, select the file, then click the Open button, the grid table will be updated. |
| This is the export calibration data file option, which allows saving the calibration data file (*.EE). Select this option, the Export Calibration Data form will be displayed as shown in Figure 3, enter a name or use the default name for the file name, then click the Save button, the file will be saved out. |
| This is the line style setting option, which allows setting the lines style of observed and modeled lines in the time series plots. There are three options when clicking this button, as shown in Figure 4. |
| This is the Information button. Click this button and the Enhanced Message Box will be displayed as described below. |


Anchor Figure 2 Figure 2
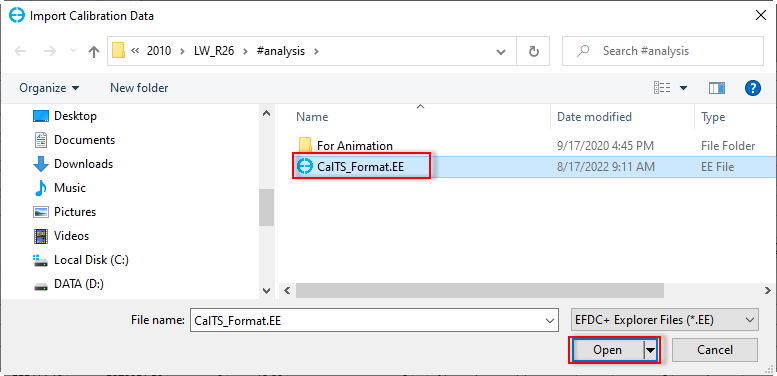
Figure 2 Import calibration data file.
Anchor Figure 3 Figure 3
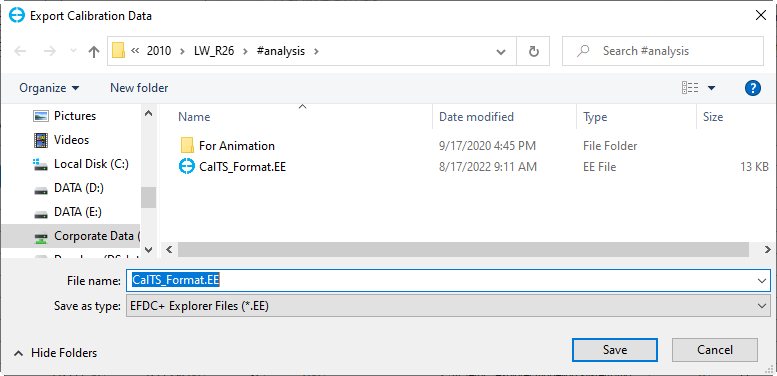
Figure 3 Export calibration data file.
Anchor Figure 4 Figure 4

Figure 4 Line style setting option.
Defining the MMA
MMA stands for minimum, maximum, and average. After selecting this option, the Line Settings form will be displayed showing the default lines names as seen in Figure 5. Press the F2 key to see more details about this option (Figure 6). In this form, [N] is the station name, and [L] is the layer name. These shown in the Data Series box, and user-configurable. The Data Series settings here will be displayed in the legend of the time-series plots. Besides using default settings, we can manually define the settings. To do this, select each line in the Data Series frame, then enter the new name for the Title in the Series Information frame. Click the OK button to apply these settings. For example, the user could change it from the default "[N] - Model, Layer Avg" to "[N] - Model ABC, Layer Avg," or from "[N] - Data" to "[N] - Observed)."
Anchor Figure 5 Figure 5
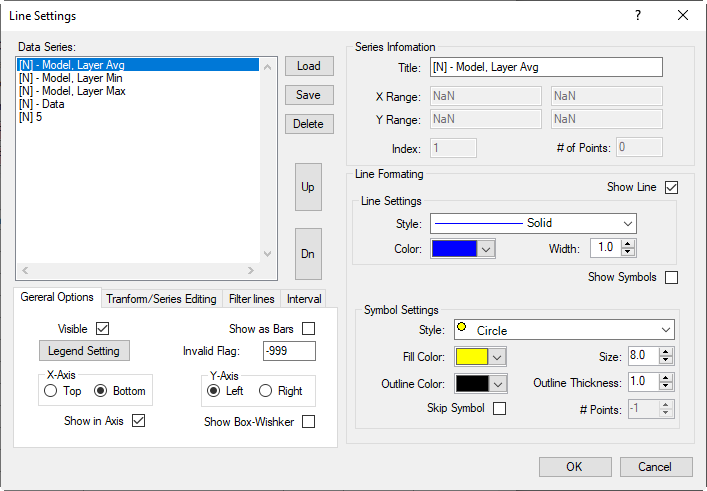
Figure 5 Line setting for MMA.
Anchor Figure 6 Figure 6
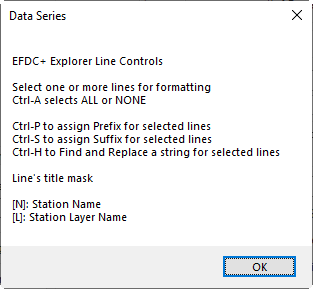
Figure 6 Data Series Tips when Press F2.
Defining Layers
After the Define Layer option the Line Settings form will be displayed and the default lines names shown as in Figure 7. Pressing the F2 key also provides information help for this form. Again, [N] is the station name, [L] is the layer name as described above. The Data Series settings here will be displayed in the legend of the time series plots. Besides using default settings, we can define the settings by ourselves by selecting each line in the Data Series frame then entering a new name for the Title of the Series Information frame then click the OK button (e.g [N] - Model, [L] → [N] - Model ABC, [L]; [N] - Data → [N] - Observed). We also can set the line style and color from the Line Formatting frame.
Anchor Figure 7 Figure 7
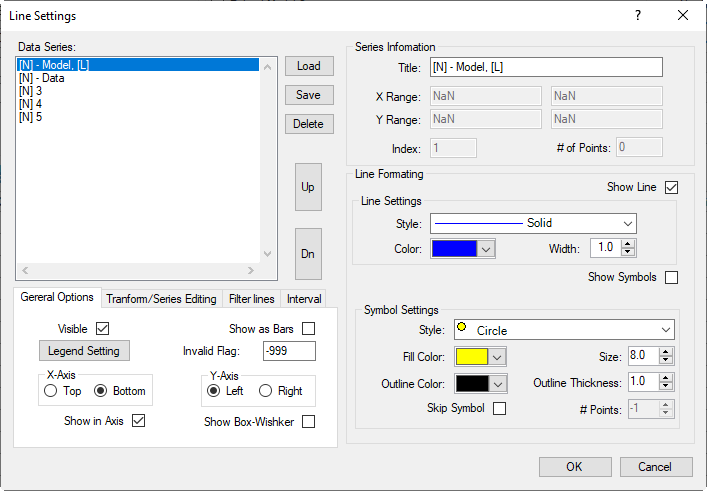
Figure 7 Line setting for MMA.
Apply User Defined Settings
The Apply User Defined option allow the user to set and apply their own line style options instead of the EE default line settings. After configuring the Define MMA and Define Layer options, in order to use those settings it is necessary to check the checkbox for Apply User Defined selected. The data series settings displayed on the legend of the time series plots will be applied to what was previously defined .
Anchor Figure 8 Figure 8
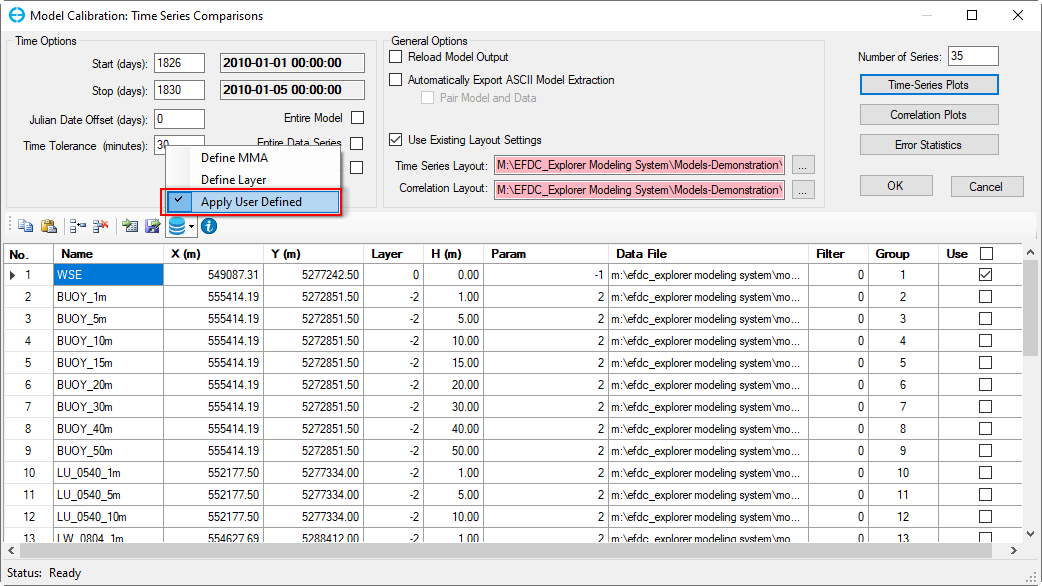
Figure 8 Appy User Defined.
For each model-data pair, the user must specify the information listed in each column:
- Name:The ID field is used for labeling the plots and statistical reports.
- X & Y: Enter the X and Y in meters of the location of the data station. The coordinate system must be the same as that used for the model. Using these coordinates the matching model cell is determined. User can check the coordinates by clicking on Get I & J button in Figure 9 that allows the user to input X and Y values in the LXLY units to determine the corresponding values of I & J.
- Layer: This is the layer specification option. There are three options as shown. The Min-Avg-Max (MMA) option generates three model time series for the cell, based on the water column layer results.
- H (m): The depth or elevation specified if the selected layer option is Fixed Depth or Fixed Elevation.
- Parameter: Select the parameter that will be extracted from the model for comparison to the data contained in the corresponding data file in Figure 9. Or user can type the parameter code in Param column in Time Series Comparisons form (Figure 1) based on the list of currently available parameters is shown in Figure 10. To show the parameter code as shown in Figure 10, the user clicks on the Information button (
 ) on the top of the table frame in Figure 9. Table 1 summarizes all parameter codes.
 - Data File: This field contains the full path to the data file, in DAT or WQ formats, for the specific parameter, location, and layer option. The user can leave this field blank to only display a model time series. Rows shown in pink indicate path names that are not valid (e.g. files were deleted by the user after initial setup) and need to be redefined. If the model path of the data has changed, highlight the cells in the column to be changed and use the CTRL+H keystroke to search and replace part of the path to update it.
- Group: This is the plot number. If each line uses a unique Group # then each model-data pair will be displayed on a separate plot. If two or more model-data lines use the same Group # they will be displayed on the same plot.
- Use: This is a flag to optionally turn on or off the plots and statistics computation for each model-data pair.
...