2DH View
To display the Water Quality in the 2DH View, open a new 2DH View from the 2DH View menu or the 2DH View button from the main toolbar of EE main form. Then click the Add New Model Layer from the Layer Control (Figure 12124185608). In the 2DH View Option, the primary group is selected as Water Quality. The drop-down list includes parameters.
- Ammonia Nitrogen (NHX)
- Nitrate Nitrogen (NOX)
- Particulate Biogenic Silica (SiP)
- Dissolved Available Silica (SiA)
- Chemical Oxygen Demand (COD)
- Dissolved Oxygen (DOX)
- Total Active Metal (TAM)
- Fecal Coliform Bacteria (FCB)
- Carbon Dioxide (CO2)
- Particulate Organic Carbon (POC)(Derived)
- Particulate Organic Phosphorus (POP)(Derived)
- Particulate Organic Nitrogen (PON)(Derived)
- Total Nitrogen (TN)(Derived)
- Total Phosphate (TP)(Derived)
- Total Organic Nitrogen (TON)(Derived)
- Total Inorganic Phosphate (TION)(Derived)
- Total Organic Phosphorus (TORP)(Derived)
- Trophic State Index (TSI)(Derived)
- TSS ( Inorganics + Organics)(Derived)
- Total Kjeldahl Nitrogen (TKN)(Derived)
- Total Dissolved Phosphorus (TDP)(Derived)
- Water Quality Zone
- Vegetation Height
- Vegetation layer penetrated
- Biota: Concentration
- Biota: Density
- Biota: Growth Factor
- Biota: Basal Metabolism Temperature Effect
- Biota: Predation Temperature Effect
The method EE uses to calculate the derived parameters can be found in Appendix C of this Knowledge Base.
Anchor Figure 1 Figure 1
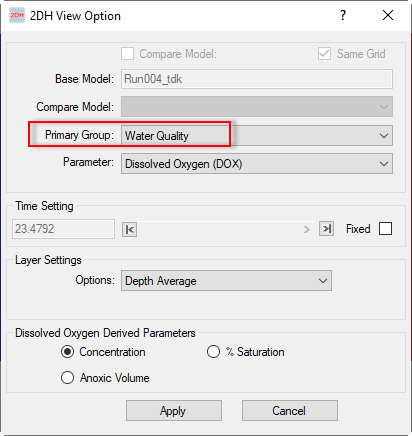
Figure 1. Add a WQ layer to the 2DH View.
In terms of biota parameters, the user can select the biota class and the unit display in the biota options, as shown in Figure 2 2124185608.
| Anchor | ||||
|---|---|---|---|---|
|
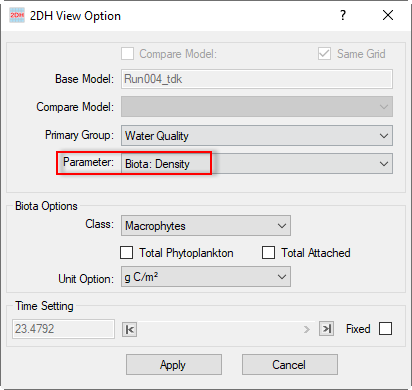
Figure 2. Add Biota Density.
A new option has been added to the With the new macrohydro options in EFDC+ vegetation can grow between layers. EEMS11.3 that allows to vegetation height and vegetation layer penetrated. Figure 3 now allows vegetation height to be displayed, as well to show when vegetation penetrates layers. 2124185608 shows a map of macrophytes macrophyte height in the 2DH View and Figure 4 2124185608 shows the a time series of macrophyte height from a selected cell.
...
Figure 4. Time Series of Macrophytes Height of a selected cell.
The Vegetation layer penetrated can he number of vegetation layers penetrated by macrophytes can also be viewed in the 2DH View (in EEMS11.3). It shows . The number of water layers that the fixed biota group presents (Figure 5)passes through can be seen in 2124185608.
Anchor Figure 5 Figure 5
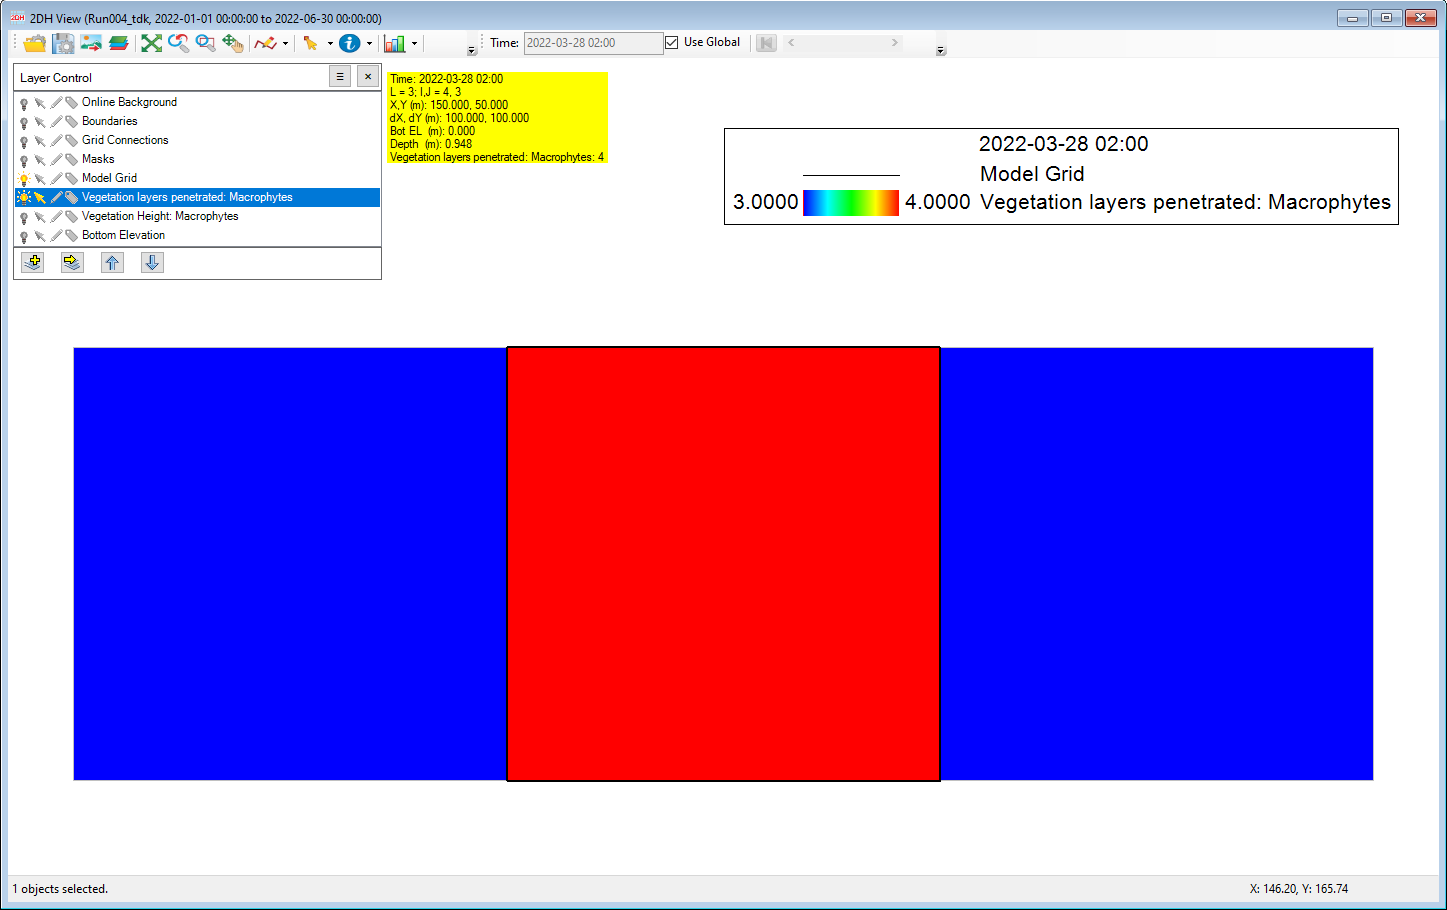
Figure 5. Vegetation Layer Penetrated: Macrophytes.
Time Series Extraction
To extract the time series of a WQ parameter from a cell or multiple cells, we can select the cells from the 2DH View and then access the Time Series menu to select New Time Series option or click the icon ![]() of the main toolbar provides access to the time series graphing utility (Figure 62124185608).
of the main toolbar provides access to the time series graphing utility (Figure 62124185608).
Anchor Figure 6 Figure 6
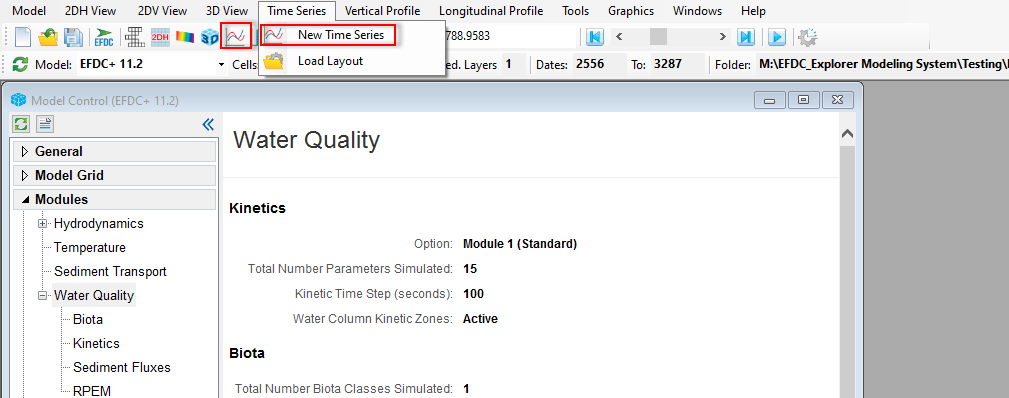
Figure 6. Access Time Series
...
Once New Time Series is selected, an Extract Time Series Data form will be displayed, and it is necessary to define the cells and parameters to plot (Figure 72124185608). Define the start and stop day for the time series in Time Series Start/Stop frame (note that the start and stop days should be within the model's start and end date). For the Biota: Growth Factor, there are many options for time series data, including Net Growth Factor, Light Limitation, Temperature Limitation, Limiting Nutrient: P or N, Phosphorus Limitation and Nitrogen Limitation. After clicking the OK button from that form, the time series of the selected WQ parameter will be shown (Figure 82124185608).
Anchor Figure 7 Figure 7
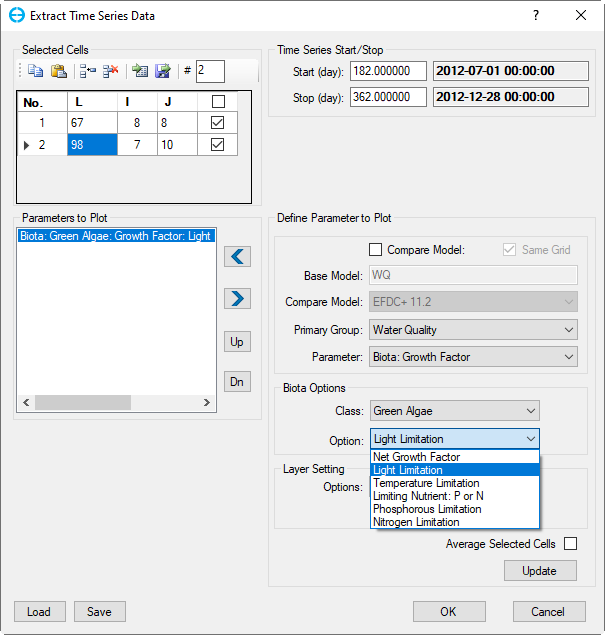
Figure 7. Extract Time Series Data form.
Anchor Figure 8 Figure 8
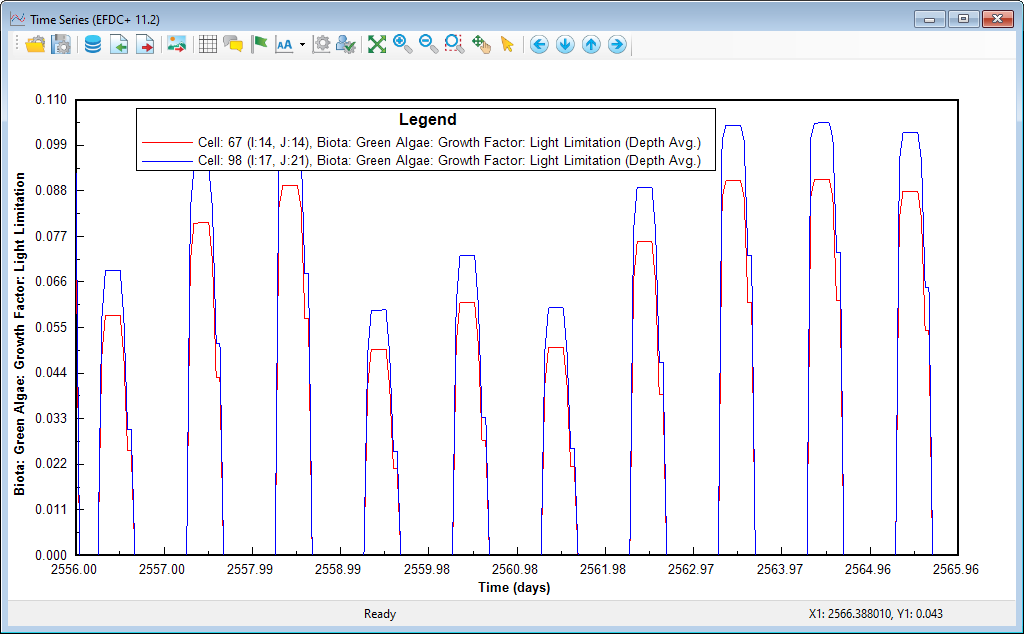
Figure 8. Time series of WQ parameter from the cells selected.
Use the Average Selected Cells checkbox to plot the time series of the average parameter values from multiple cells selected as shown in Figure 92124185608. Note that after selecting the checkbox, the user needs to click the Update button and then click the OK button. An example of the averaged depth time series from the selected cells is shown in Figure 102124185608.
Anchor Figure 9 Figure 9
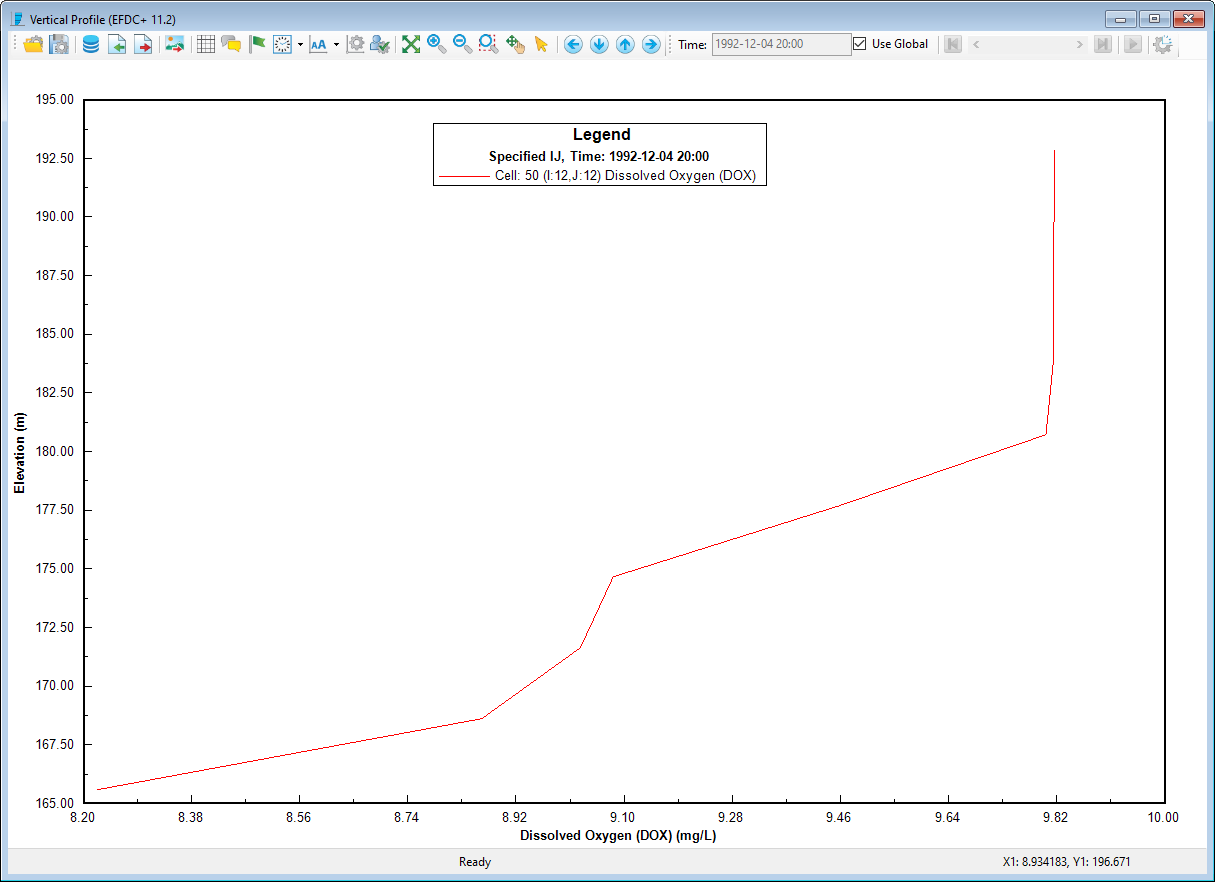
Figure 9. Average Selected Cells.
Anchor Figure 10 Figure 10
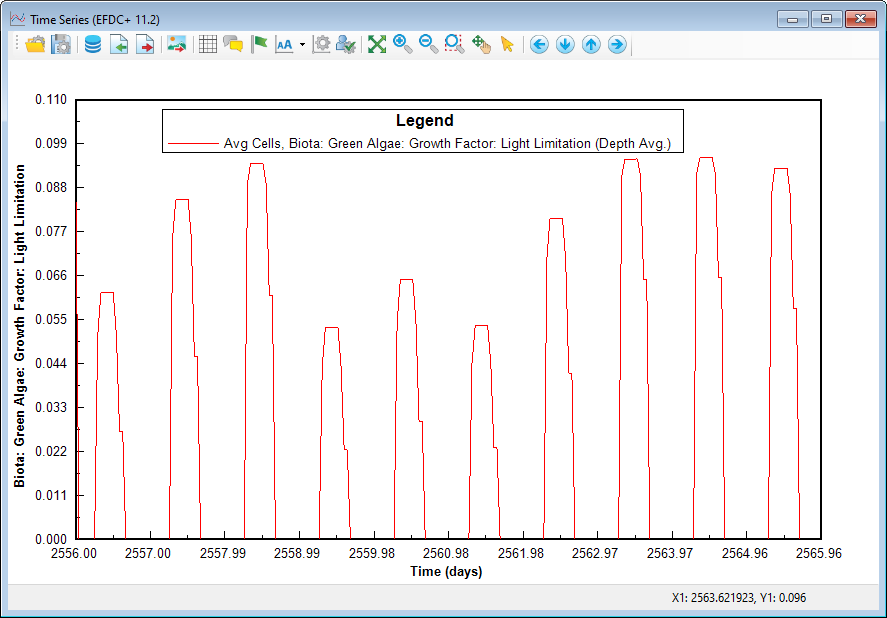
Figure 10. An averaged light limitation time series plot from selected cells.
...
The vegetation height at a specific time is illustrated with symbols in 2DV (this feature is added to EEMS11.3) as shown in Figure 112124185608. Vertical Profiles, 2DV View, and Longitudinal Profiles are the same as the description in the Salinity Visualization.
Anchor Figure 11 Figure 11
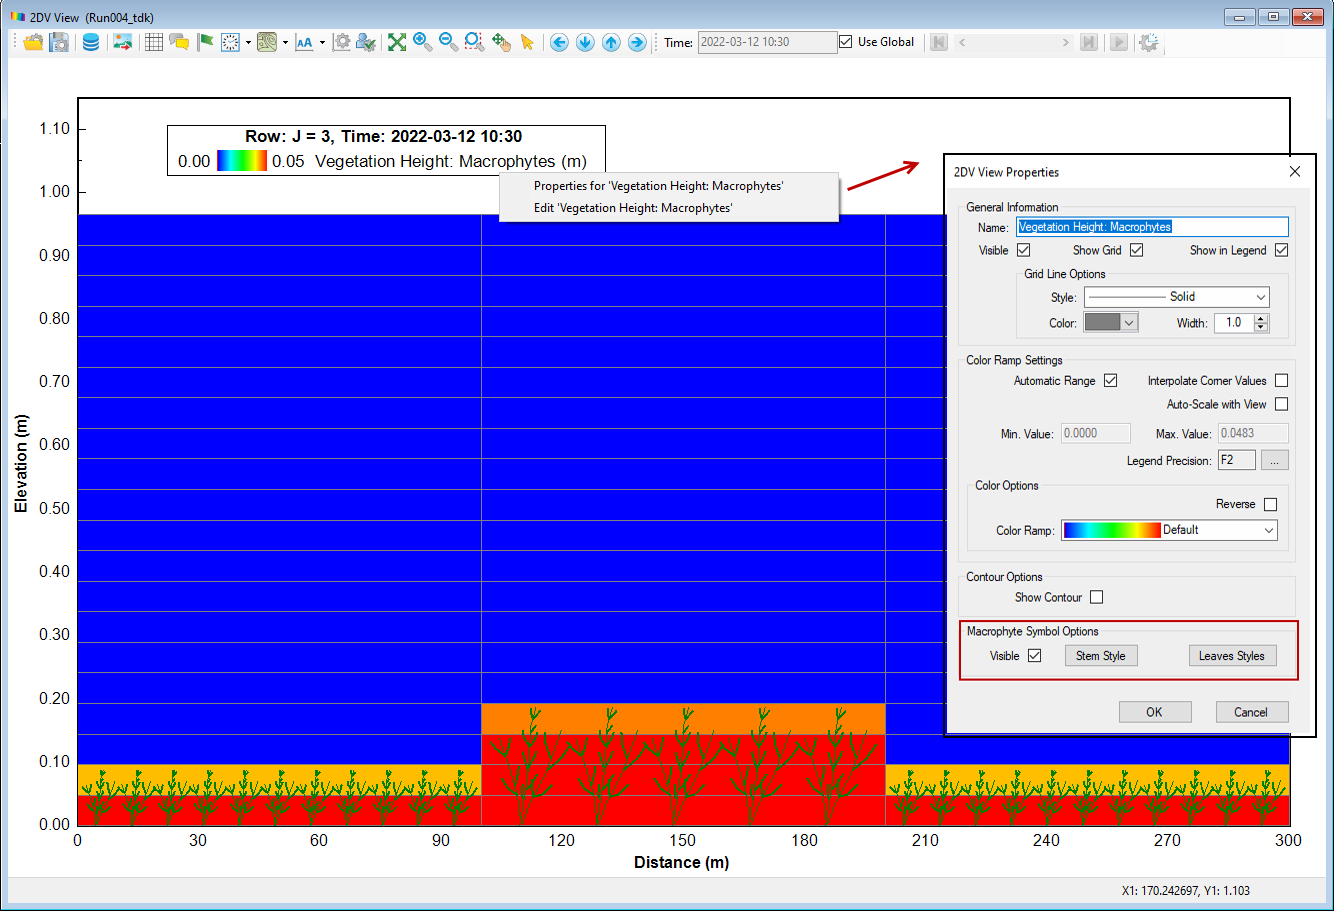
Figure 11. The Macrophyte Height in 2DV View.
...