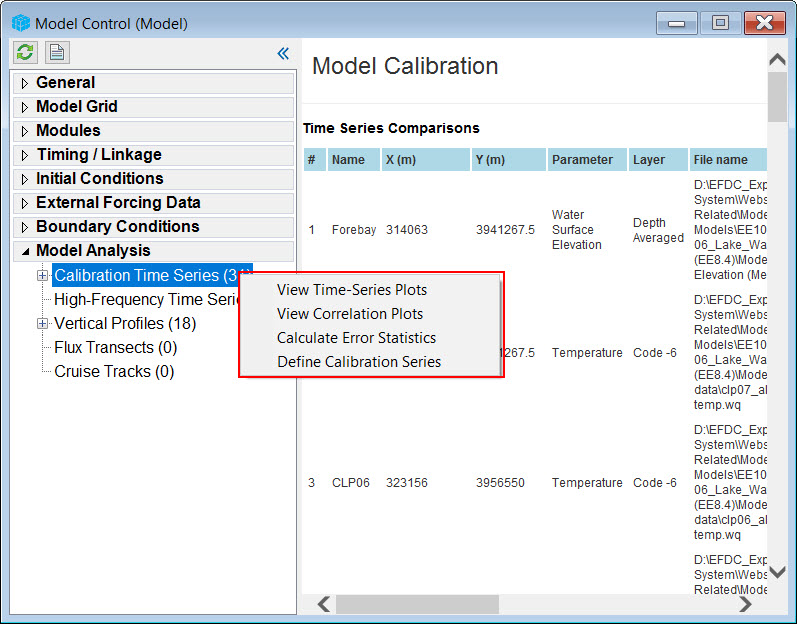
The Model Analysis menu that provides access to the calibration features available in EFDC+ Explorer as shown Figure 1. There are six types of calibration plots that may be generated:
For each of these, the user needs to provide a linkage of the water column model results to measured data.
Each of the sub-menu items may be summarized with a LMC, and RMC provides a number of options as outlined below and described in detail in the following sections:

Figure 1 Post Processing Options - Main Form.
The plot styles are saved in the EFDC+ Explorer configuration file "CalForm_TS.EE," "CalForm_CP.EE" and "CalForm_VP.EE" for the time series, correlation and vertical profile plots respectively. In addition, the file "CalForm_MMA.EE" contains plot styles for the time series option of Min-Avg-Max plots (see Time Series Graphing for more details).
The time series, correlation and vertical profile model-data linkages provided in this section are only one means of conducting model-data comparisons. Almost any model parameter can be compared to data using the Import Data feature of the time series plotting utility. See Time Series Graphing for more details.