Longitudinal Profiles
The longitudinal profile can be plotted by selecting the Longitudinal Profile button on the main toolbar. If no longitudinal profile window is currently selected, the only option is New Longitudinal Profile (Figure 1).
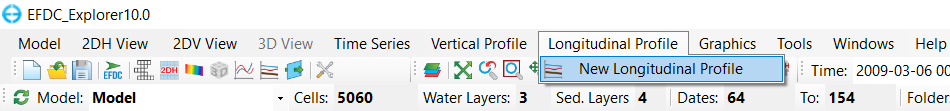
Figure 1. Access New Longitudinal Profile from the main toolbar.
Upon selecting New Longitudinal Profile, a Data Extraction for Longitudinal Profile form will appear (Figure 2). This form is similar to the Data Extraction for 2DV View form (covered in 2DV View). The user first selects an option to define the profile and then defines the parameter to the plot. Once everything is ready, click OK to generate the plot. Figure 3 shows a longitudinal profile for water surface and bottom elevation along the profile I=25.
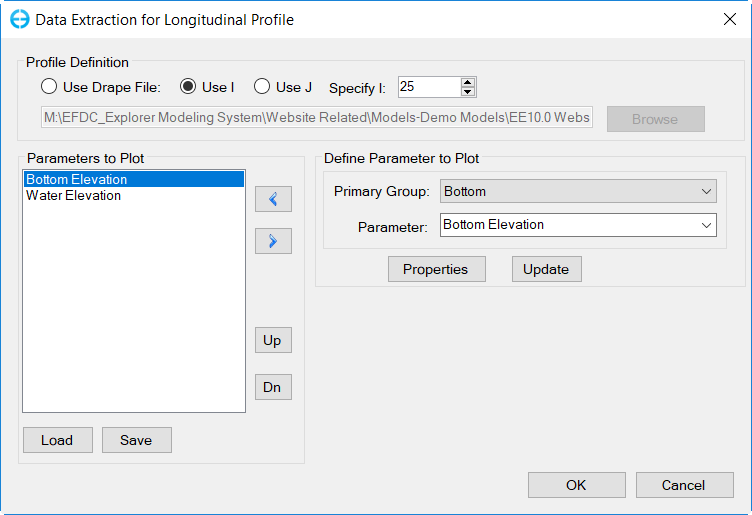
Figure 2. Data Extraction for Longitudinal Profile form.
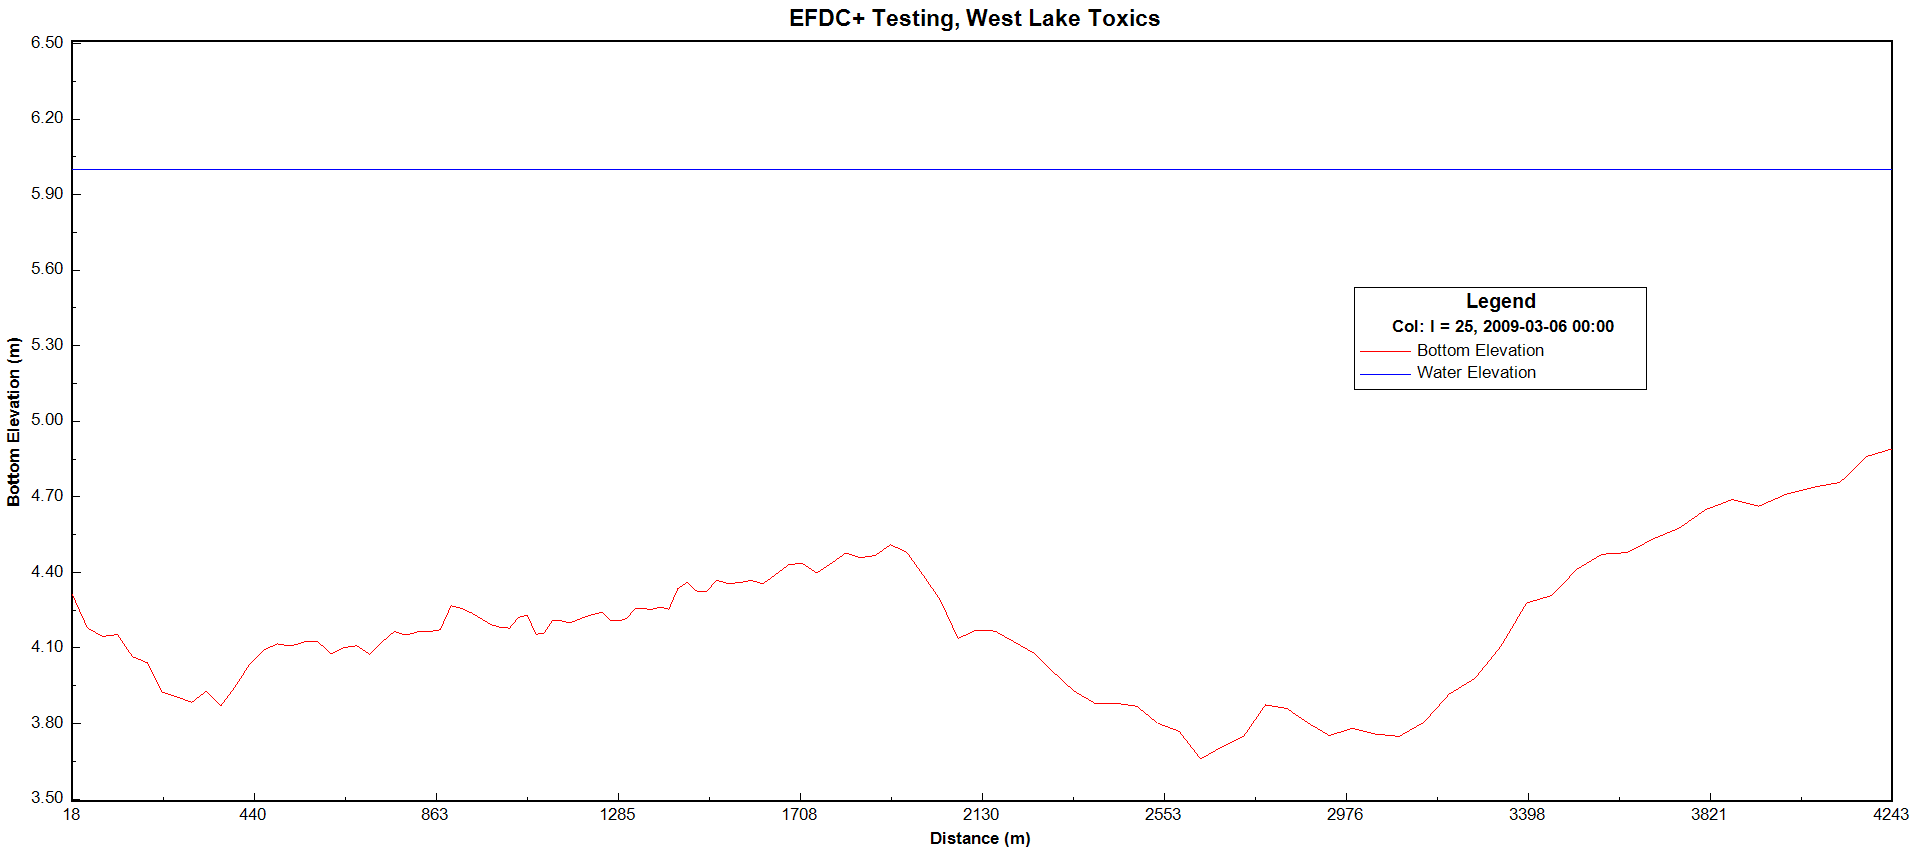
Figure 3. Longitudinal Profile plot.
The Longitudinal Profile plot use the time series graphing utility so the user can RMC on various elements of the plot (axes, title, legend) to edit and re-configure them. RMC on the legend will show the Data Series form, which is identical in function with the Data Series form covered in Series Options.
With the longitudinal profile plot window selected as the current window, click on Longitudinal Profile on the main toolbar will show additional items (Figure 4). The function of these items is identical to the toolbar menu's items discussed in 2DV View.
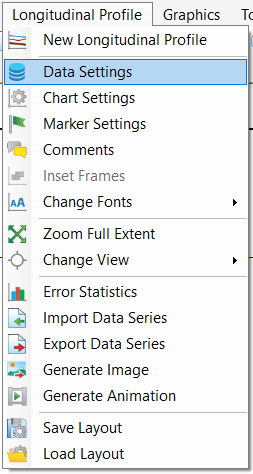
Figure 4. Longitudinal Profile toolbar menu.