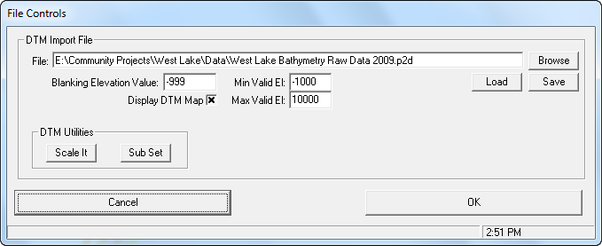
When the Options is selected a window in appears allowing the user browse to the DTM file and load it as shown in Figure 4 271. When a file has been selected, click the Load button to load the information.
...
| Anchor |
|---|
...
|
Blanking Elevation Value
This option selects what value to fill in missing elevation data points. -999 is the standard input for missing values.
...
DTM Utilities
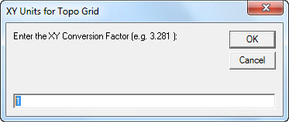
This frame offers two options to the user. The Scale It button allows the user to input a conversion factor that will convert the units from meters to another unit such as feet. The input window is shown in Figure 4 282.
...
| Anchor |
|---|
...
|
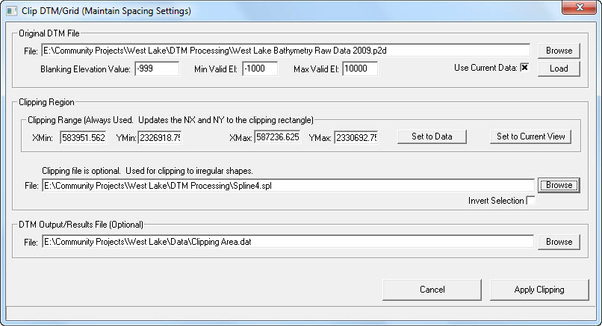
The second button in this frame is Sub Set. Selecting this button displays the window shown in Figure 4 293. The various options available here are described in detail below.
...
| Anchor |
|---|
...
|
Clipping Region
The user is able to enter Min and Max values for X and Y of two defined points for clipping rectangle. If the Set to Data button is selected, the fields for X/YMin and X/Y Max values will fill in automatically based on DTM data file loaded. If the Set to Current View button is selected, the clipping region will be generated base on the screen view set by the user.
The user can also define the clipping region by browsing to the desired file then loading. The region outside of the clipping line will be cropped. In case the Invert Selection check box is selected, the region outside of the clipping line will be retained.
The user can save the region after clipping by browsing to the desired directory and naming the output file. Then click the Apply Clipping button for the changes to take effect.
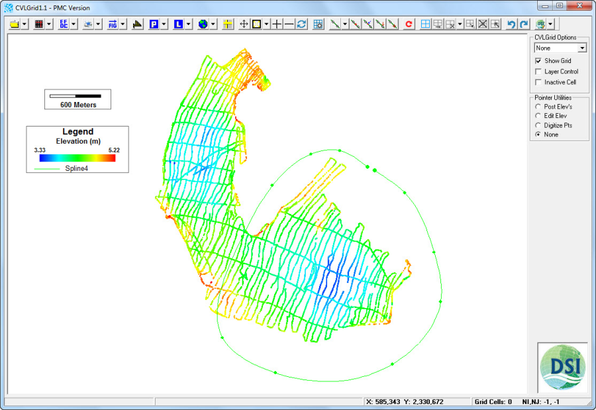
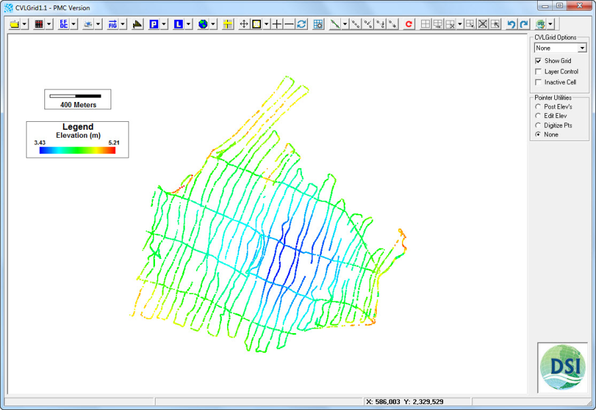
Figure 4 30 and Figure 4 31 5 and Figure 6 show visualizations of DTM data before and after clipping by a polyline.
...
| Anchor |
|---|
...
|
...
| Anchor |
|---|
...
|