The Boundary Data Series form for Wind boundary condition is nearly identical with the general form discussed in External Forcing Data, with except for the addition of the Rose Plot function (as highlighted in Figure 1).
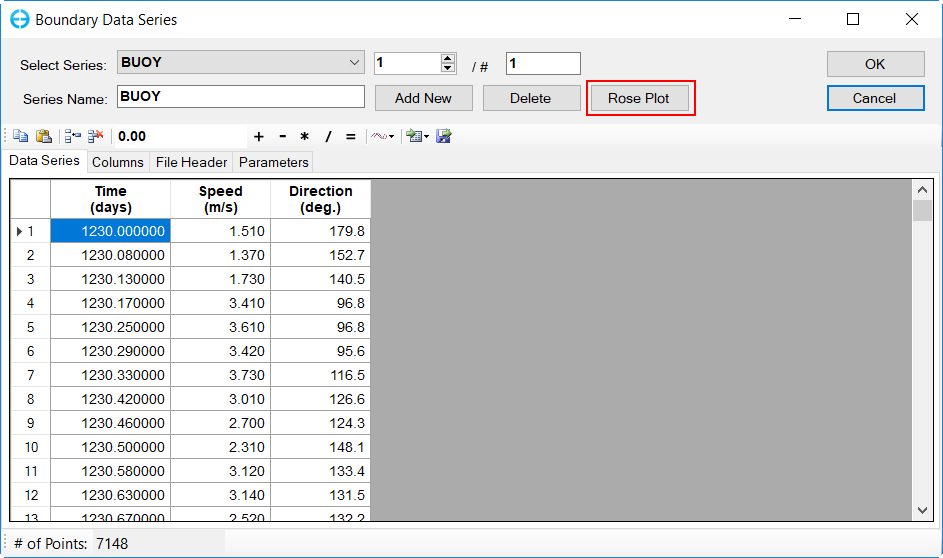
Figure 1. Boundary Data Series form for wind with Rose Plot highlighted.
Click Clicking on the Rose Plot button after entering entering a data series table will open the Rose Plot Utility window. RMC anywhere on this window will show Settings, Export Bitmap and Export Metafile ( Figure 2 )
In Settings, the user can customize the rose format, editing the wind rose labels and setting the number of sectors. When setting the sector options the user can select the number of sectors, the number of degrees for the gap between sections and switch on and off the outline of the sectors.

Figure 2. Rose Plot Utility.