...
An example of a report generated by EE is shown in Figure 2. The bottom of the report contains a listing of the composite statistics for the entire model run. The parameters may be copied to the clipboard for pasting into Excel or some text editor. A good practice is to save these statistics in each run’s directory for quick future reference.
| Anchor | ||||
|---|---|---|---|---|
|
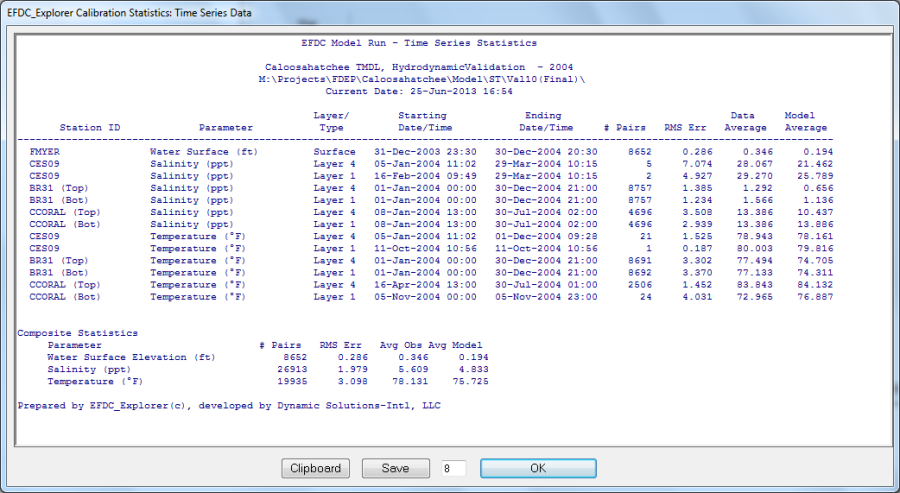
Figure 2 Example time series calibration statistics report.
EE used the same approach for calibration statistics that is does for the time series statistics, such that it generates a set of model/data pairs focusing on the measured data points. EE uses a linear interpolation approach to generate the model value corresponding to the measured data point in time. So, if there were 20,000 data points (from 15 minute data for example) which are corresponding to 5,000 model model snapshots, EE will generate 20,000 model/data pairs.