...
As an example of the vertical profile plotting function, Figure 2 shows a single page containing a subset of time snapshots for salinity for a data single data station for a 5 layer model.
| Anchor | ||||
|---|---|---|---|---|
|

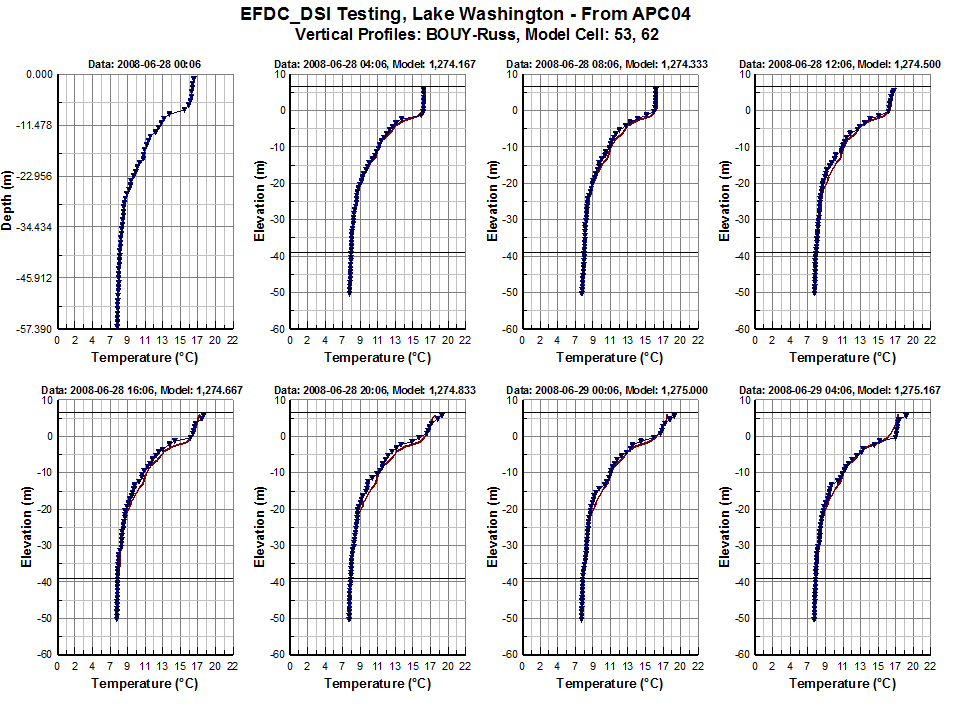 Figure 2 Example model-data vertical profile plot for salinity.
...