The Viewing Opt | Boundary C's allows the user to display the location and type of boundary conditions currently defined as shown in Figure 1. The user may also view the associated time series forcings. These depend on the type of time series defined: whether lookup table or equation based. The View Cell Lookup Table and View Group Lookup Table are used when the HS uses a lookup table.
| Anchor | ||||
|---|---|---|---|---|
|
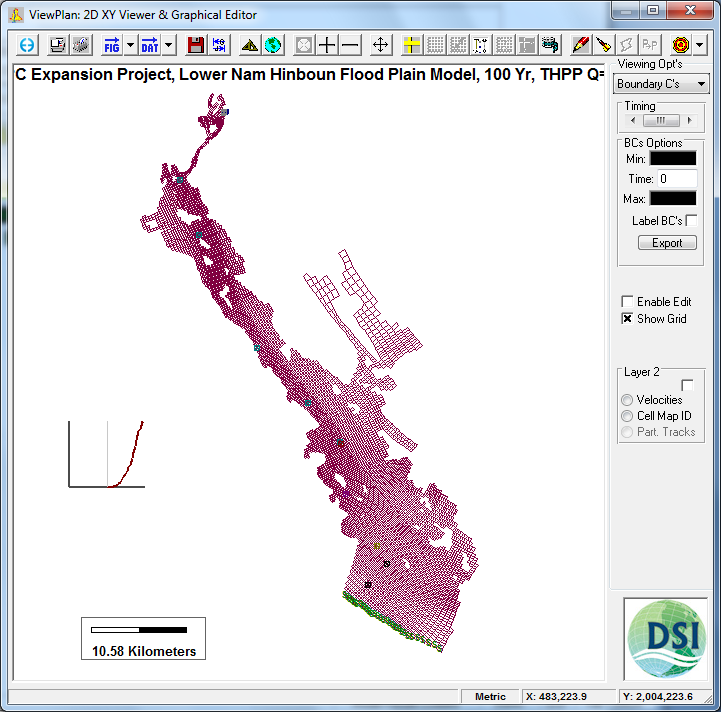
Figure 1 View Plan: Boundary conditions.
...
If the HS uses an equation then the View Cell Time Series and View Group Time Series options are enabled as shown in Figure 2. An example of how to use these options is provided below.
If editing is enabled when the user RMC's on a cell, the menu (shown adjacent) is displayed. The user can choose:
...
LMC'ing on a cell that has one or more boundary conditions currently assigned to that cell lists the boundary group(s) and reports on the boundary forcing at the time shown in the Options Area. The user can enter new times between the Min and Max shown and the forcings will be displayed.
...
| Anchor | _Ref444525091 | ||||
|---|---|---|---|---|---|
| _Ref444525091 | |||||
| Anchor | |||||
|

Figure 2 View Plan: Boundary conditions RMC popup menu.
...
An example of how to view the time series is shown in Figure 3. This model has an open (tidal) boundary at the western boundary and an open (tidal) boundary in the eastern boundary. A culvert has been configured in the middle of the domain, with the upstream cell of the culvert marked with a "U" and the downstream cell marked with a "D". The downstream (D) cell for the culvert has been RMC'd and the user can now select a look-up table or time series. If the culvert does not use a look-up table this option is not available. In this case the culvert has a time series for flow which will be displayed as shown in Figure 4.
...
| Anchor | _Ref443576415 | |||
|---|---|---|---|---|
| _Ref443576415 | ||||
| Anchor | ||||
|
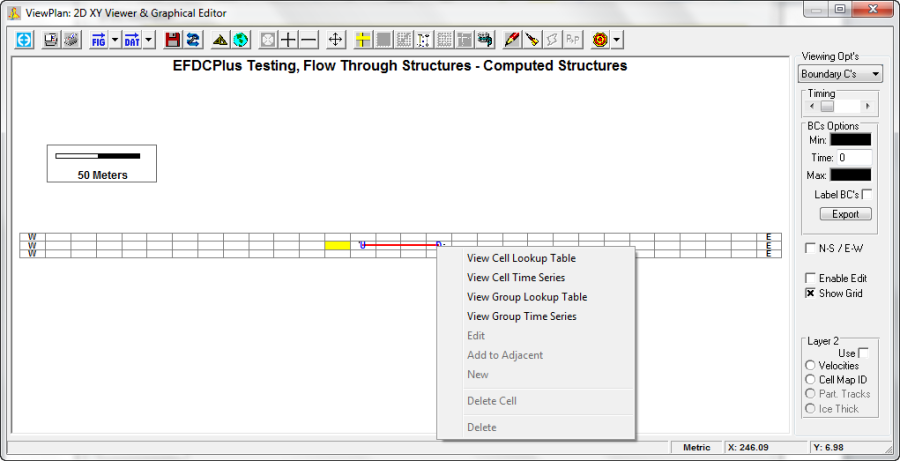
Figure 3 Viewing flow time series in a culvert. 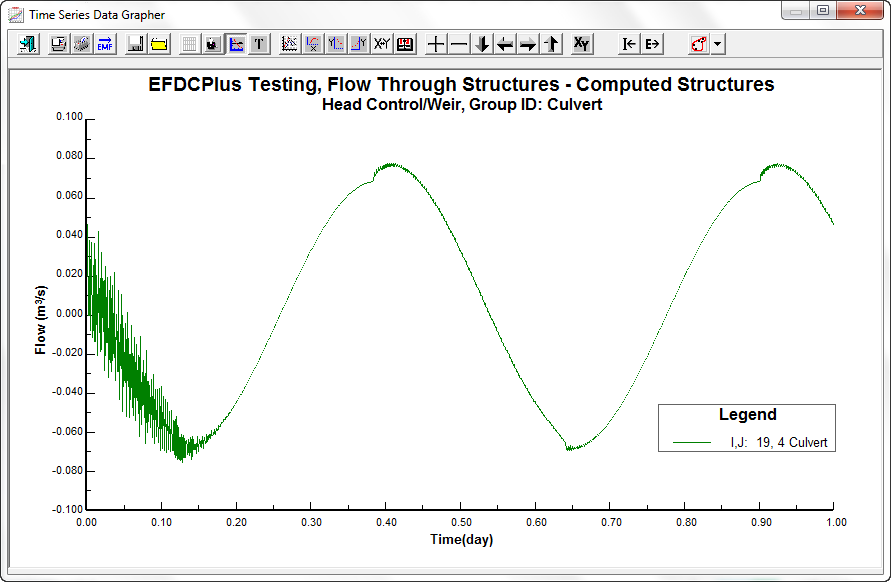
| Anchor | _Ref443576420 | |||
|---|---|---|---|---|
| _Ref443576420 | ||||
| Anchor | ||||
|
Figure 4 Time series for a culvert.