...
Line statistics by time block may also be displayed with the keystroke Alt-S. This is similar to a box and whisker plot data, but it generates a set of statistics. When the user wants to analyze each line by month they should select "1 M". All the data is tab delimited and copied to the clipboard. The statistics generated are the average, standard deviation, minimum, maximum, lower quartile, median, upper quartile, standard error 95% and confidence interval. ( See Figure 2)
| Anchor | ||||
|---|---|---|---|---|
|
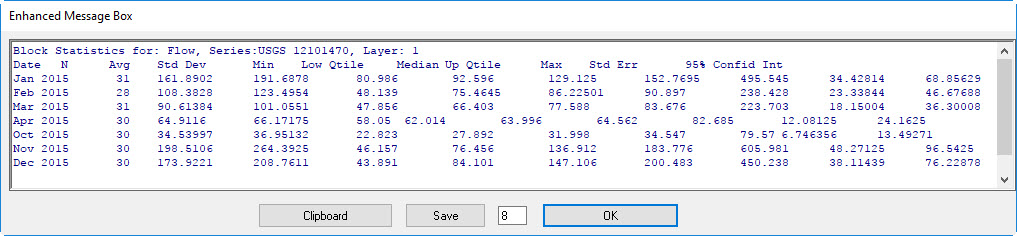 Figure 2 Time Block Statistics of Time Series.