The 2DV View button and the icon ![]() of the main toolbar provides access to the profile/cross-section post-processing utility of EE as shown in 223248391 Figure 1. This option was called ViewSlice in previous versions of EE.
of the main toolbar provides access to the profile/cross-section post-processing utility of EE as shown in 223248391 Figure 1. This option was called ViewSlice in previous versions of EE.
| Anchor | ||||
|---|---|---|---|---|
|

Figure 1. Access 2DV View from the main toolbar.
Selecting the New 2DV View button will open a new form where user can define the location of the profile and parameters to be displayed as shown in 223248391.
...
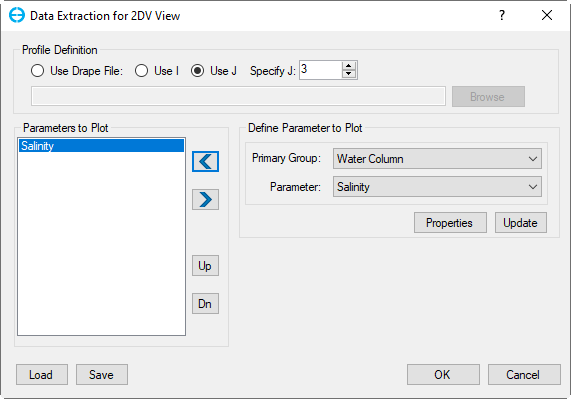
Figure 2. Data Extraction for 2DV View form.
...
from
...
The user select should then select which parameters are to be displayed in Define Parameter to Plot frame. First choose the Primary Group, then the necessary Parameter from that group and select the left arrow button ![]() . The user may select more than one parameter to plot. The parameters selected are displayed in Parameters to Plot frame, where the user can also remove the parameter by using the right arrow button
. The user may select more than one parameter to plot. The parameters selected are displayed in Parameters to Plot frame, where the user can also remove the parameter by using the right arrow button ![]() save current 2DV layout, load an external 2DV layout or move the layers up and down. This will change the order in which layers are drawn by EE. The Update button will replace the currently highlighted parameters in Parameters to Plot frame with the currently selected parameters in Define Parameter to Plot frame. The Properties button will open the 2DV View Properties form where the user can configure the color ramp, contour, precision, range and other settings (223248391). Click OK to plot 2DV View.
save current 2DV layout, load an external 2DV layout or move the layers up and down. This will change the order in which layers are drawn by EE. The Update button will replace the currently highlighted parameters in Parameters to Plot frame with the currently selected parameters in Define Parameter to Plot frame. The Properties button will open the 2DV View Properties form where the user can configure the color ramp, contour, precision, range and other settings (223248391). Click OK to plot 2DV View.
...
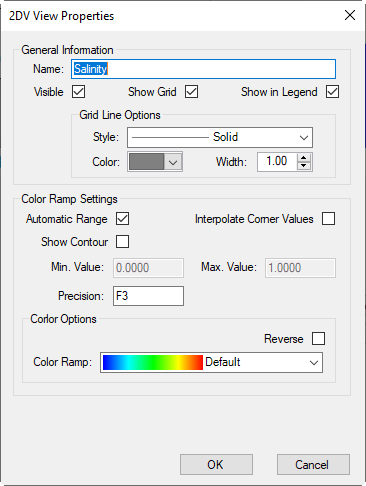
Figure 3. 2DV View Properties form.
An example of the plot is shown in 223248391. Information about the current cell can be displayed (the yellow text box), as in 2DH View, by LMC on the cell. Many of the operations of this feature are similar to 2DH View.
...
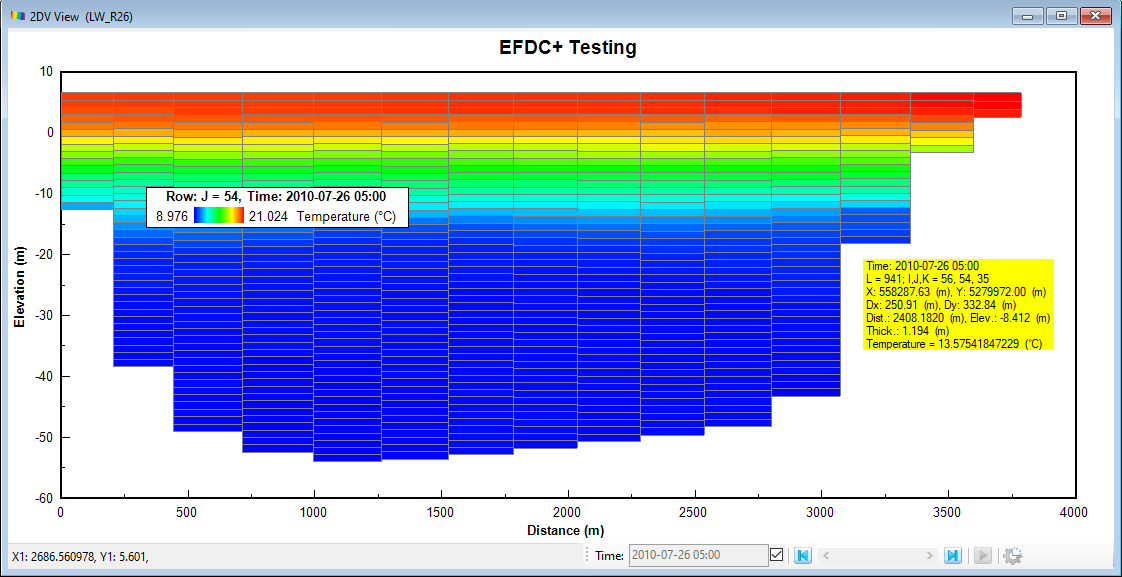
Figure 4. Example of 2DV View plot for temperature.
Similar to 2DH View, RMC on various elements of the plot (axes, title, legend) allows the user to edit and re-configure them.
A feature unique to the 2DV View is that different RMC position on the legend will display a different form.
If the user RMCs on the top of the legend (highlighted in 223248391), a 2DV View Setting form will be displayed.
...
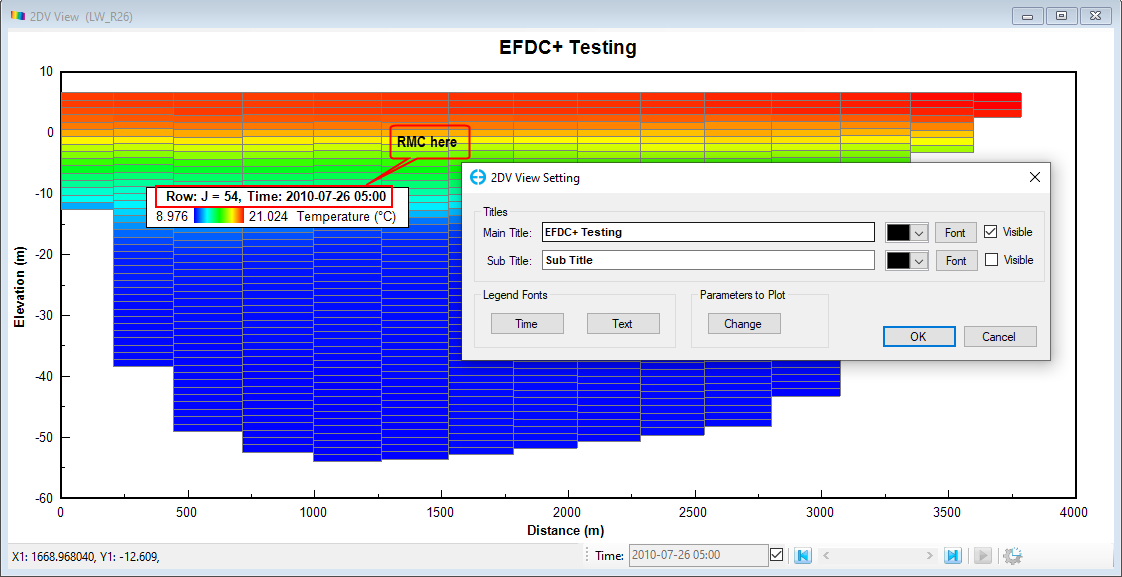
Figure 5. RMC on the top of legend box shows 2DV View Setting.
...
the
...
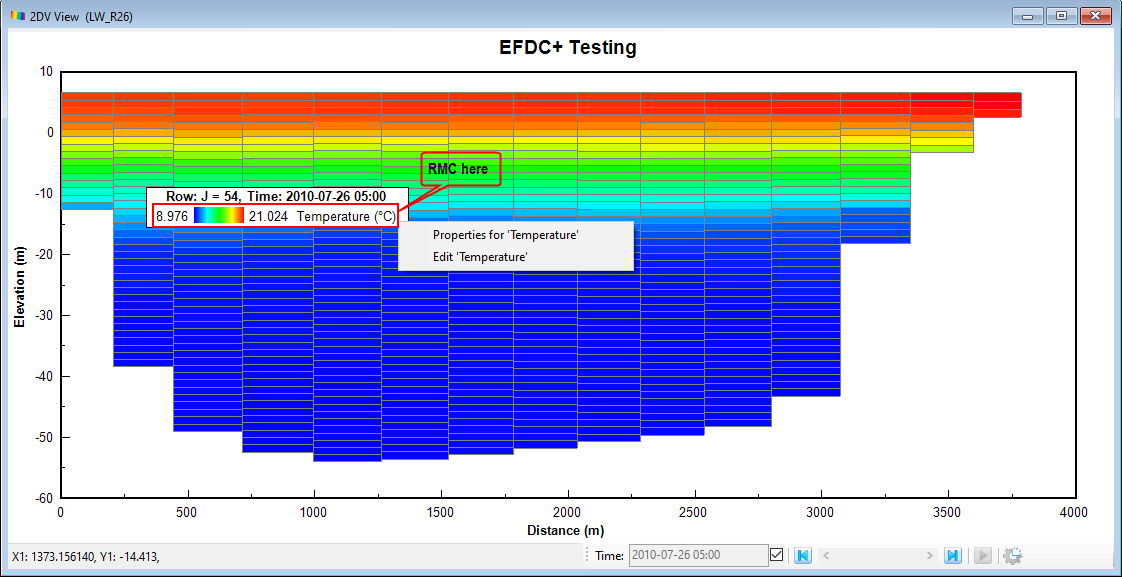
Figure 6. RMC on the bottom of legend box.
Toolbar Menu
...
main
...
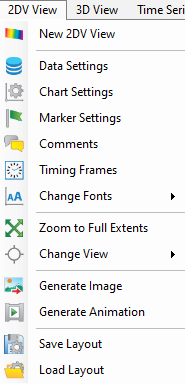
Figure 7. 2DV View toolbar menu.
Data Settings: Open the form Data Extraction for 2DV View.
Chart Settings: Allows the user to change the font, box line, and contents of the main/sub-title. Allows the user to change the format, line length, column number, background color, and border style of the legend. Allows the user to change the font, content, position, and scaling of the axes.
Marker Settings: Allows the user to set a marker line at any value of the axes. Choose the X or Y axis in Orientation frame and then choose the value of the marker in Value box. Line style, color or shape of symbol can also be customized.
Comments: Allows the user to add comments into the plot. The font, content, color and background color of the comment can also be adjusted here. Check on the Visible check box to enable the comments.
Timing Frames: Allows the user to add timing frame of boundaries to the 2DV View. When the tool is selected, the Timing Frames form appears as shown in 223248391.
Change Fonts: Allows the user to increase/decrease the font size for all the axes/ legends at once.
Zoom to Full Extents: Zoom to the full extent of the data range.
Change View: Tools that assist the user in controlling of the view-port/camera.
Export/Import Data Series: Export the current data of 2DV View so that it can be imported as a drape file later. The user has the option to choose the location of the file with Browse, by default the animation will be saved in #analysis folder of the active model.
As with the 2DH View, the user can export images and animations from the plot with Generate Image and Generate Animation.
Generate Image: the user should select a name for the image and select the folder to save out the image by clicking Browse button then click OK button to finish, by default the image will be saved in #analysis folder of the active model.
Save/Load Layout: Save the current layout settings of 2DV View (axes, legend,... settings) as a *.vsl file so they can be loaded later. The user has the option to choose the location of the file with Browse, by default the file will be saved in #analysis folder of the active model.
Generate Animations: displays the Generate Bitmap/Animation form, by default the animation will be saved in #animations folder of the active model. Alternatively, the user can set name for the animation and folder to save out the image by clicking Browse button. Setting options for the animation file can be applied in this form such as start/stop animation timing, and number of time steps to skip. Finally click OK button to start exporting the file (see 223248391).
The results of any of the time dependent results can be output as an animation to an AVI file. If the animation is to be saved to an AVI file, the user is asked for the number of frames per second to be output to the file. This will be application specific, but a number of 10 frames per second generally provides a fairly smooth, but not too fast animation. The user should be aware that these files can get quite large quickly. The frame size of the animation will match the frame of the 2DV View. Press the "Escape" key to stop an animation (see 223248391). Click Yes to quit generating animation, click No to continue generating animation.
...
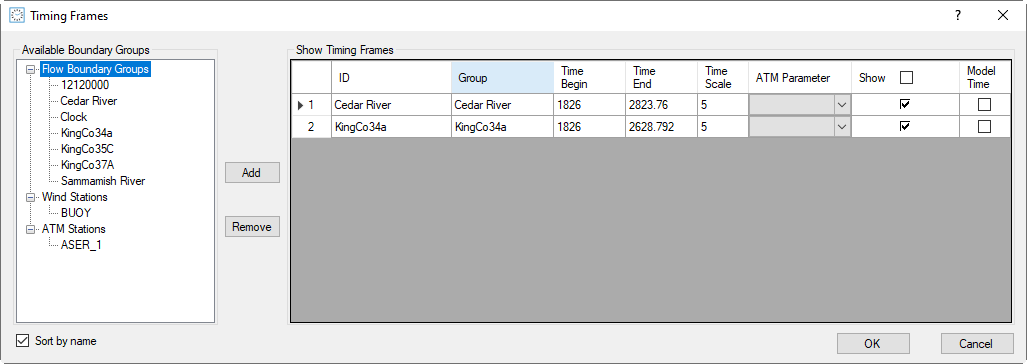
Figure 8. Timing Frames form.
...
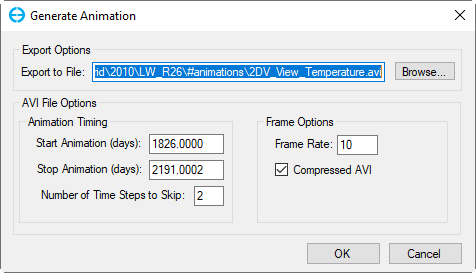
Figure 9. Generate animation.
...
Figure 10. Stop generate animation.