Many of the plotting features of EFDC_Explorer use the time-series graphing utility. In addition to the time series plotting, time series graphing utility is also used for any XY plot as well as 2DV View (but with a different plotting subroutine). Figure 1 shows a screen capture of the graph generated by the time time series graphing utility. This figure demonstrates the capability of the utility to import multiple data files for comparison with model results.
Anchor Figure 1 Figure 1
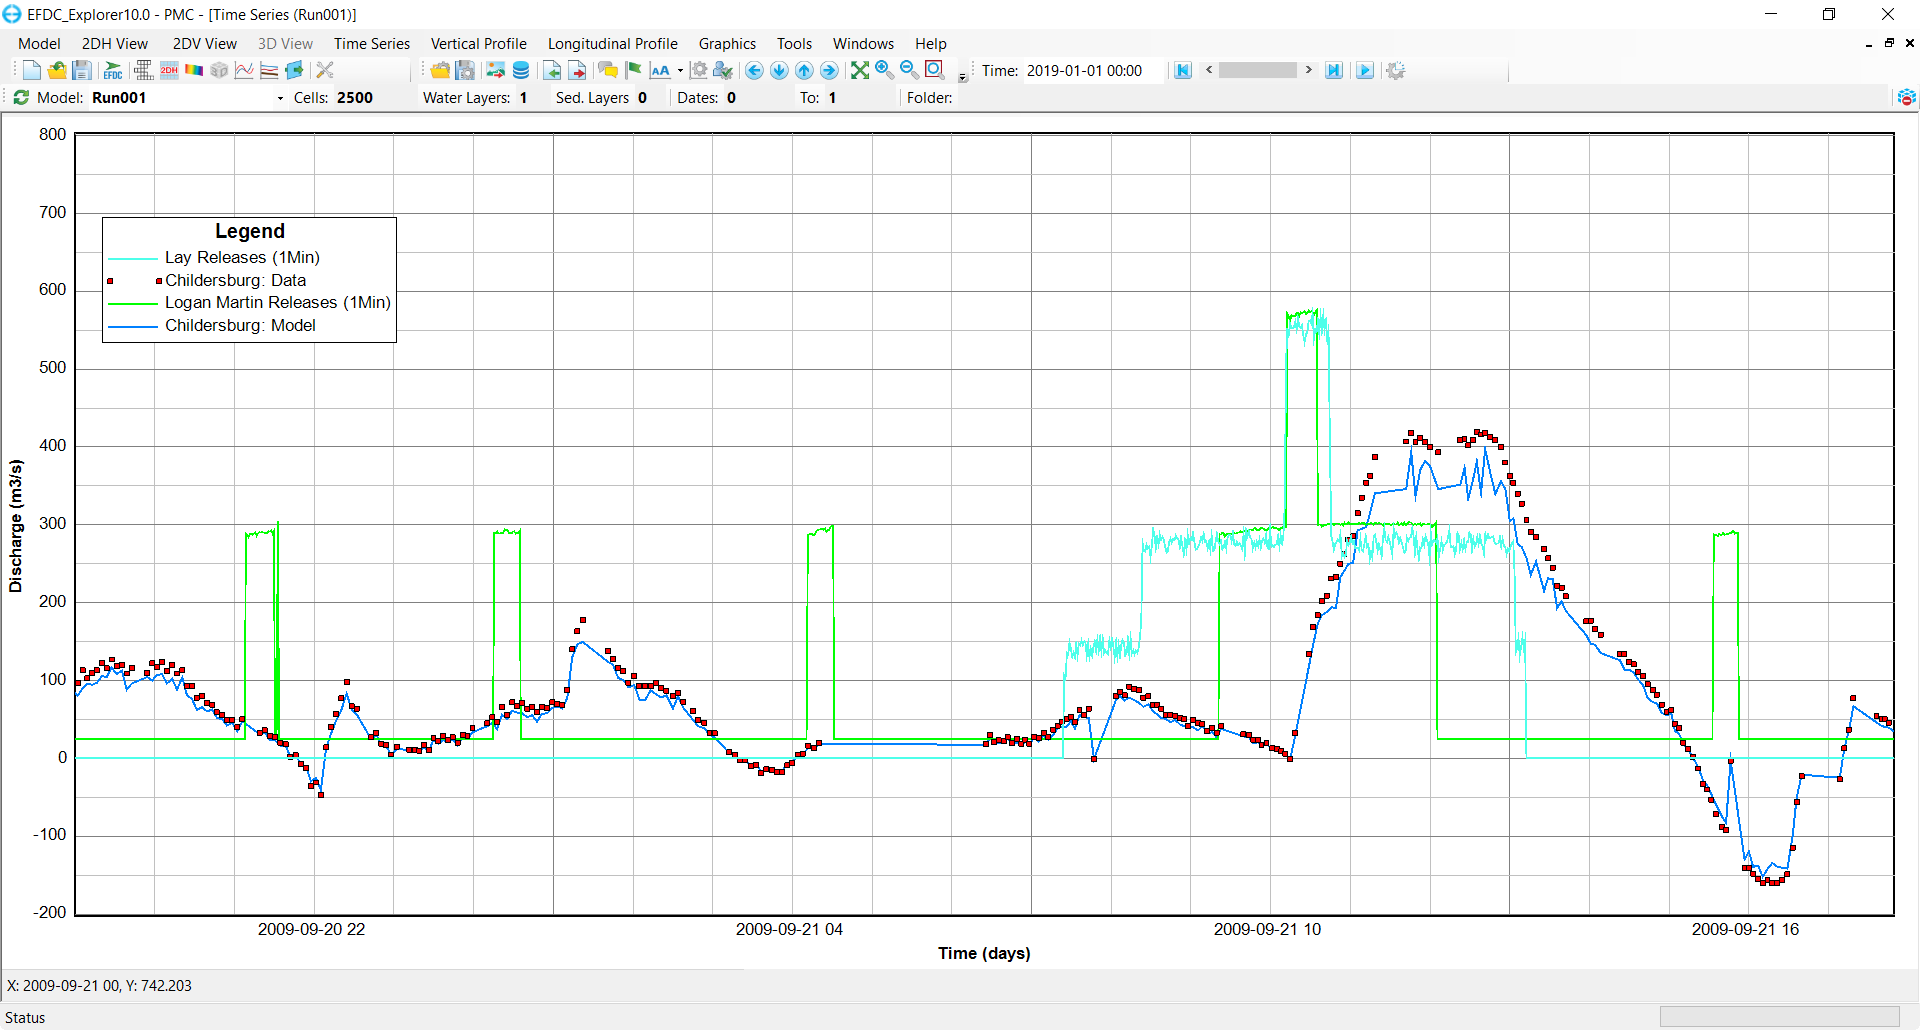
Figure 1. Time Series Plot.
The Time Series button and the icon ![]() of the main toolbar provides access to the time series graphing utility of EFDC_Explorer (Figure 2). If no time series window have has been created yet, the only option available to the user is New Time Series and New Blank Plot button.
of the main toolbar provides access to the time series graphing utility of EFDC_Explorer (Figure 2). If no time series window have has been created yet, the only option available to the user is New Time Series and New Blank Plot button.
Anchor Figure 2 Figure 2
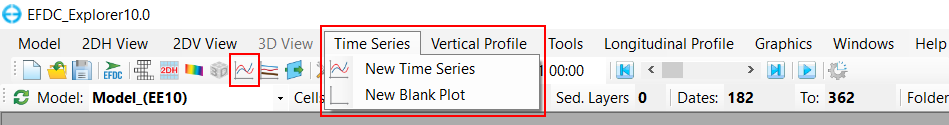
Figure 2. Access Time Series from the main toolbar.
...
Selecting New Blank Plot will open a blank plot while selecting New Time Series button will open a new form where the user can define cells and parameters to plot (Figure 3)
Anchor Figure 3 Figure 3
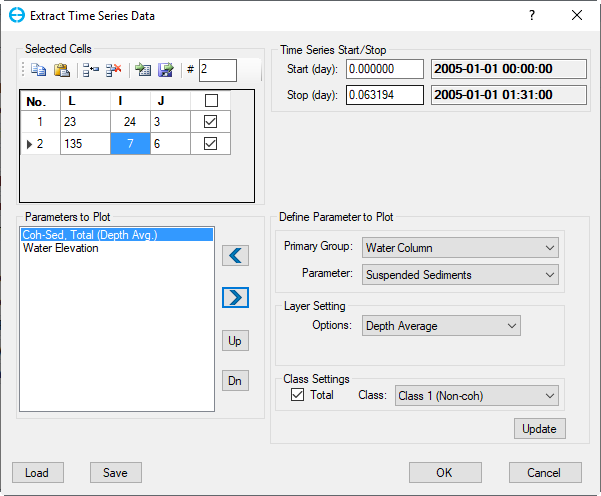
Figure 3. Data Extraction for 2DV View form.
To define the cells to the plot, the user should enter the number of cells in to into the box highlighted in Figure 3, then enter the L index of the cells, and then press enter (alternatively, enter the corresponding I and J). The user can choose whether to plot these cells by checking on the check boxes checkboxes corresponding to each cell. Next The next step is to select the parameters to plot. Similar to 2DV View, the user firsts selects the Primary Group, then the Parameter from that group, and then uses the left arrow button to add that parameter to the Parameters to Plot frame. The user may select more than one parameter to plot. Parameters selected are displayed in Parameters to Plot frame, where the user can also save/ load the current time series layout, or remove the parameter with the right arrow button. The user may define the start and stop day for the time series in Time Series Start/Stop frame (note that the start and stop days should be within the model's start and end date). Clicking OK plots the selected graphs.
Similar to 2DV View, RMC on various elements of the plot (axes, title, legend) allows the user to edit and re-configure them. This is further elaborated in Series Options.
...
When the Time Series window is selected as the current window, clicking on Time Series on the main toolbar will show additional items (Figure 4). The function of these item items is identical to the toolbar menu's items discussed in 2DV View.
Anchor Figure 4 Figure 4
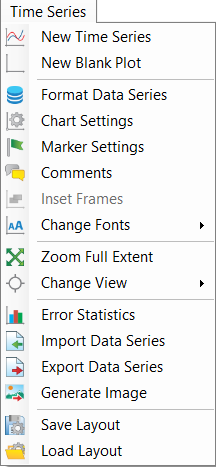
Figure 4. Time Series toolbar menu.
The Import Data Series and Export Data Series options are extremely useful to save a data series out to a file, and then later, when viewing another model or other series, load that series in for comparison. The format of these files is shown in Appendix B. A "DAT" file (the default extension) can contain almost unlimited series. Since the time-series graphing utility is used to view every time series from water column to sediments and boundary forcing series, the user can develop their own series from data for calibration or any other comparison purposes.
...