...
| Anchor | ||||
|---|---|---|---|---|
|
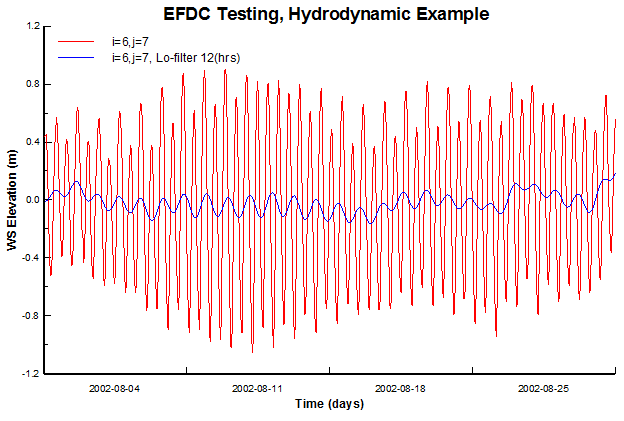
Figure 7. Time Series plot of WSEL (red) and low pass filter (blue) at location i=6, j=7.
Interval
The Interval tab in Figure 8 provides options for the user to adjust the time period between data points in the plot.
For example, Figure 9 presents the time series of the velocity magnitude from the model output with a 1-minute interval, therefore there is a gap line when the data is missing. When the user uses the interval options and selects the interval greater than the previous one, the missing data can be removed as shown in Figure 10. In the Interval tab, When plotting data time series which has gaps (missing data), the plot will have a straight line as shown in Figure 9. In order to remove that straight line, the Interval tab in the Data Series form as shown in Figure 8 can be used. Select the Interval, EE will calculate the interval and count in the underneath table, the interval is in days, base on the interval, we enter a value which should be greater than the interval in the box next to the Use Interval (days), click Use Interval (days) checkbox, select the interval and then next click Apply . The model interval and the number of data points are summarized in the box. button. Then click the OK button, the plot without the straight line is shown as Figure 10.
| Anchor | ||||
|---|---|---|---|---|
|
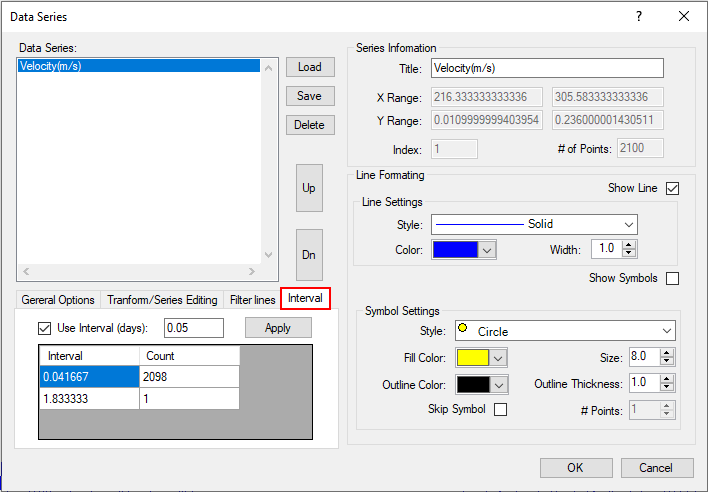
Figure 8. Interval options.
...
Figure 9. The time series plot before applying intervalsthe interval option.
Anchor Figure 10 Figure 10
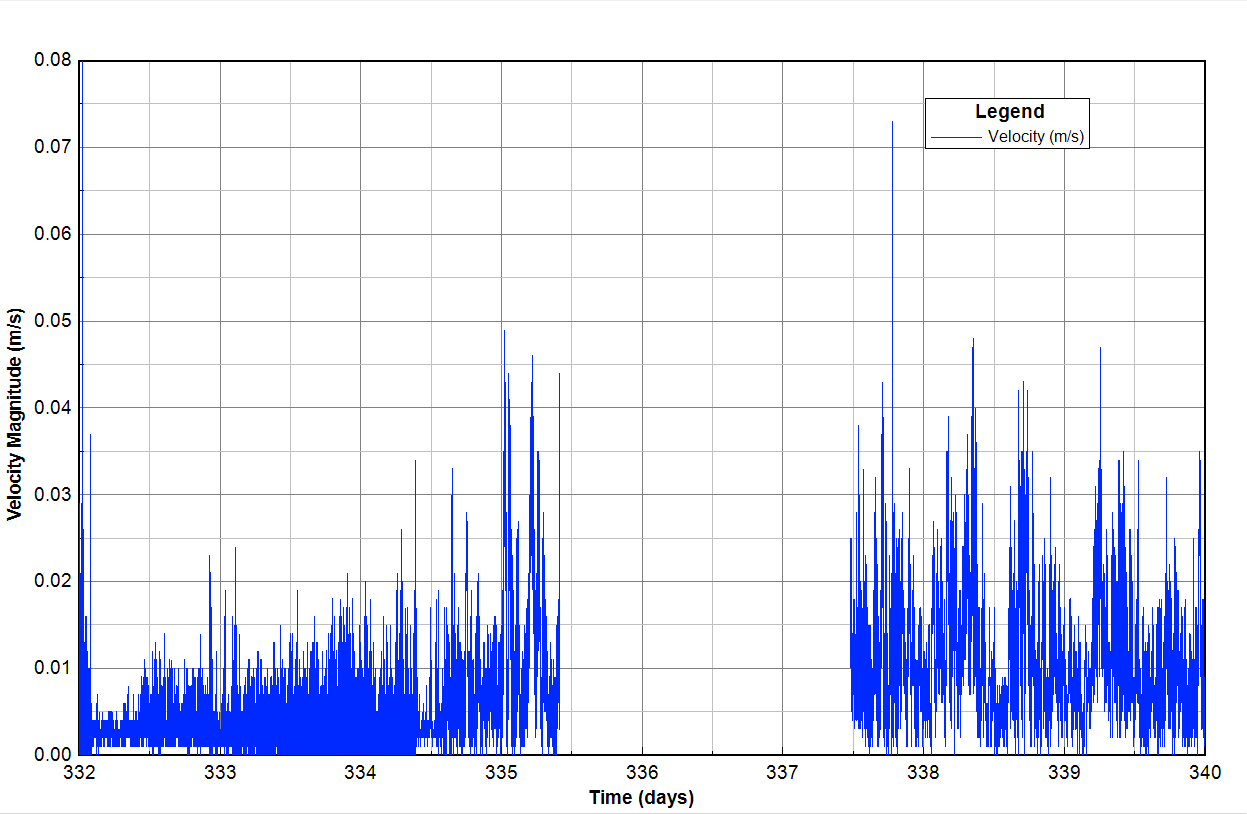
Figure 10. The time series plot after applying intervalsthe interval option.