...
...
Data Extraction Constituents
The form of Data Extraction form assists users in defining the location of the profile and the parameters to be displayed in 2DV View as shown in Figure 1in 2132574327. From the Primary Group it is possible to select Model Grid, Velocities, Water Column, and others. The number of groups varies and depends on the modules simulated in the model. Once selecting a group for the Primary Group completed, a list of parameters for the selected group is displayed in the Parameter.
| Anchor | ||||
|---|---|---|---|---|
|
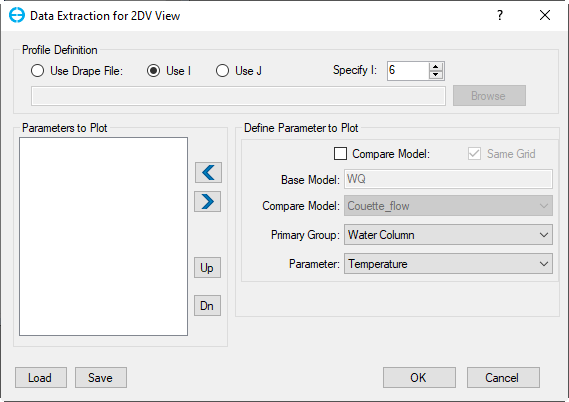
Figure 1. Data Extraction from 2DV View form.
The Profile Definition frame needs to be set before a profile can be extracted from EFDC. There are three options shown in Figure 1 2132574327. It is possible to select a value of I to extract the active J cells along that I, or select a value of J to extract the active I cells along that J. The third option is to use a "Drape Line", which is a polyline in the same coordinate system as the LX, LY data. The I & J's along this line will be assembled, and the profile will be output along with that slice. If an I or J extraction is used, the user can scroll up and down the select a coordinate.
...
The Properties button will open the 2DV View Properties form where the user can configure the color ramp, contour, precision, range, and other settings (Figure 22132574327).
Figure 3 2132574327 and Figure 4 2132574327 is a 2DV View example for selecting the temperature of the I = 38 at a specific time.
...
Figure 4. An example of 2DV View.
...
Data Extraction of EFDC Arrays
A new option for 2DV View has been developed to the EEMS11.3 version. It allows to view 2DV plot of parameters of EFDC arrays. To select EFDC Array's parameters are similar to other parameters described above. Select EFDC Arrays for the Primary Group, and then select a parameter from the drop-down list as shown in Figure 5 2132574327. The meaning of these parameters is described in Table 1 2132574327 below. An example of 2DV View for vertical eddy viscosity is shown in Figure 62132574327.
Anchor Figure 5 Figure 5

Figure 2. Select an EFDC Arrays Parameter.
...
| Parameter | Description | Unit |
|---|---|---|
| DZC | Vertical layer thickness as a decimal fraction of water depth dimensionless | unitless |
| Turbulent intensity | L*L/T*T | |
| DML | Turbulence dimensionless length | unitless |
| LENGHT | Turbulence length scale | meters |
| AV | Vertical Eddy viscosity | L*L/T |
| AB | Vertical Eddy diffusivity | L*L/T |
...