1. Introduction
This tutorial provides guidance onto on how set up an EFDC SEDZLJ sediment model of the Yen & Lee experiment which measured bed topography and sediment sorting in a channel bend subject to unsteady flow conditions. This model is available for download from the EEMS website and some input files from are needed from this to follow this guidance.
To summarize summarize the Yen & Lee experiment, 20 cm of non-cohesive sand with known size gradation were placed in a laboratory channel bend with 11.5-m entrance and exit lengths, a central angle of 180° degrees, an inner radius of 4 m, and a channel width of 1 m. The channel was adjusted to a slope of 0.002 parallel to the center line (the inlet is higher than the bend, which is higher than the outlet.) The base flow was 0.02 m3/s (corresponding to a water depth of h0 = 5.44 cm) and increased linearly to a different peak value for each run (i.e., run 1-run 5, where peak flow rates decreased with increasing run number) and then returned linearly to the base flow (Yen&Lee 1995).

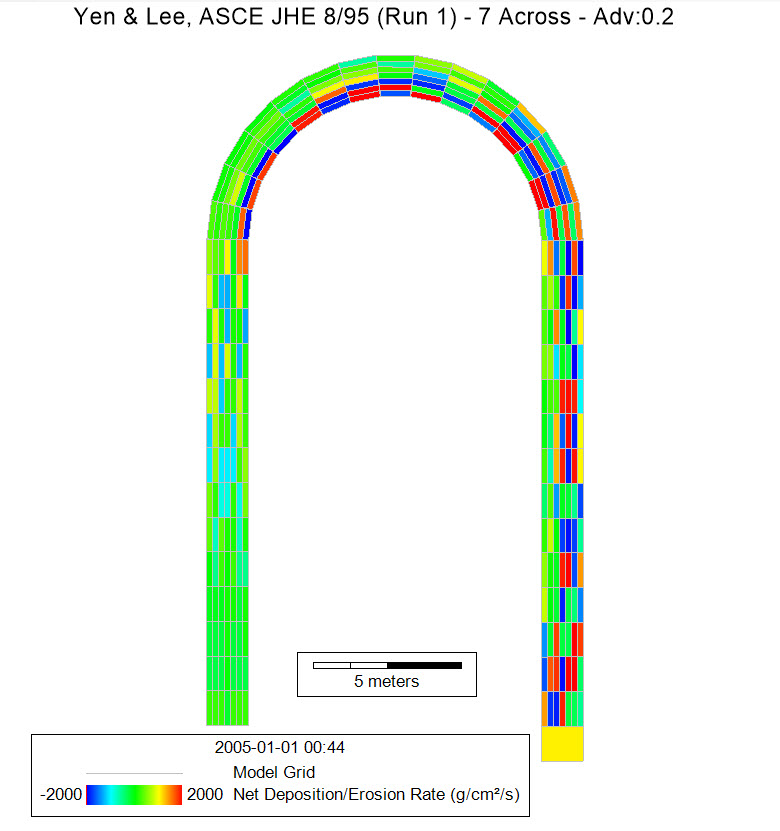
Figure 1. Yen&Lee Experiment Run 1 results.
This model example will be is based on the Yen & Lee experiment and is constructed in EE10 using state-of the-art sediment transport sub-model SEDZLJ which has been developed by Sandia National Laboratories and now incorporated to EEMS
...
3. In Grid Tool, select Import Grid from Files and the Import Grid button will become available. After clicking on Import Grid, a new form appear (Figure 3). The user should choose the Grid Type according to the data files (RGF Grid or CVL Grid) and then click on Browse to browse to the "EFDC_Grid" data file (available from the EEMS website)

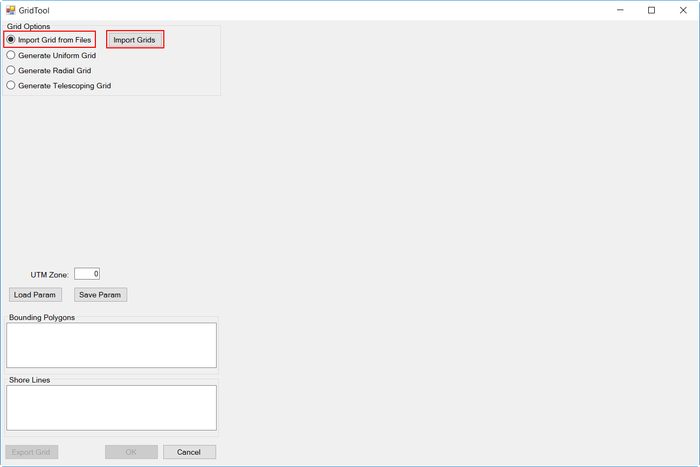
Figure 2 Generate EFDC Model and Import Grid Form.
...
Figure 3 Browsing for grid file.
4. Click OK button to finish grid creation.

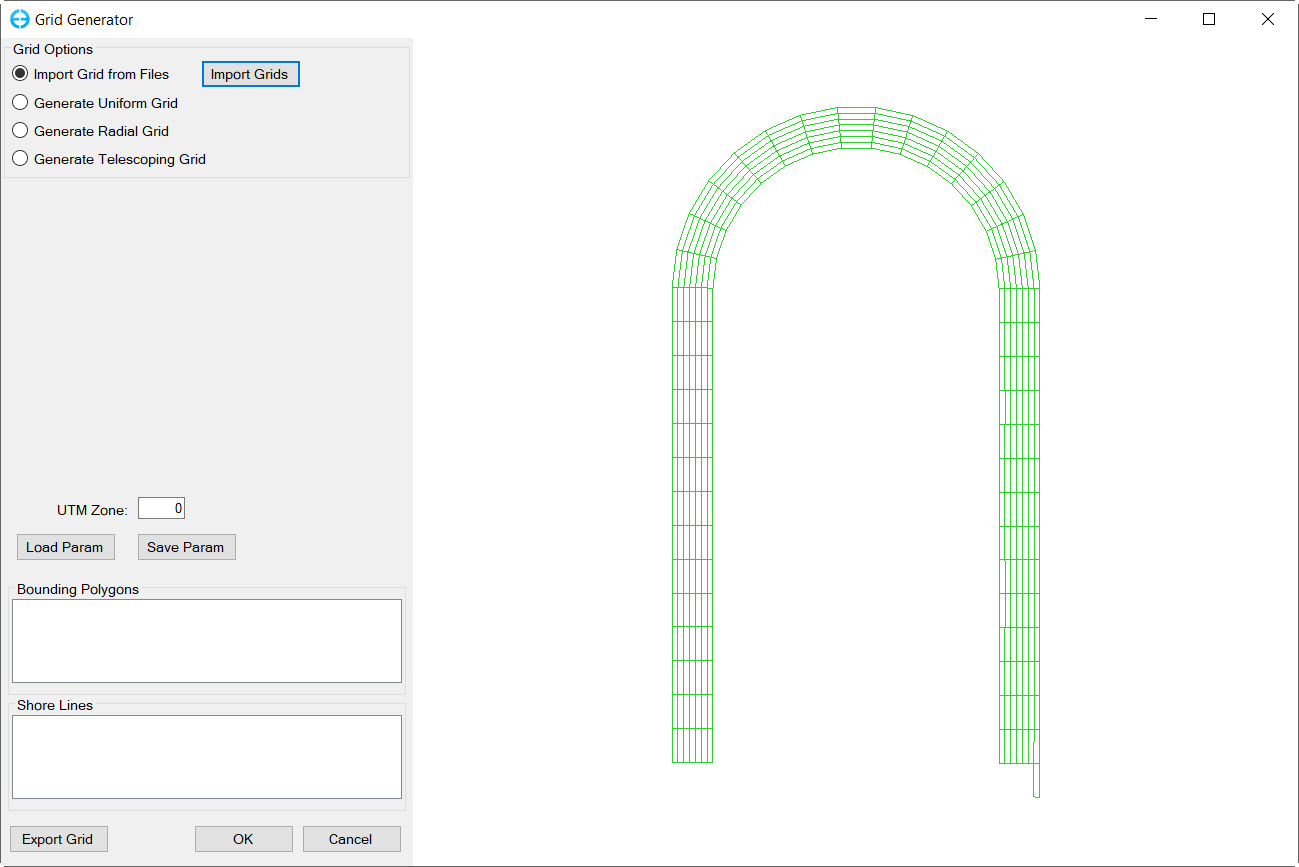
Figure 4 Created grid.
...
8. In the new Flow Boundary Conditions form, select the flow table associated with this inflow boundary time series from the Flow table drop-down list
9. Select All to apply to all selected boundary cells. Click on Dist Factor to distribute flow to all boundary cells.
...
4. In the new Hydraulic Structure Boundary Conditions form, select the rating curve data series from the Rating Table drop-down list
5. Select All to apply to all selected boundary cells
...