...
When plotting data time series which has gaps (missing data), the plot will have a straight line, as shown in Figure 9. To remove that straight line, the Interval tab in the Data Series form as shown in Figure 8 can be used. Select the Interval, EE will calculate the interval and count (number of data points) in the underneath table; the interval is in days. Based on the interval, the user can enter a value that should be greater than the interval in the box next to the Use Interval (days), click Use Interval (days) checkbox, next click Apply button. Then click the OK button, the plot without the straight line is shown as Figure 10.
| Anchor | ||||
|---|---|---|---|---|
|
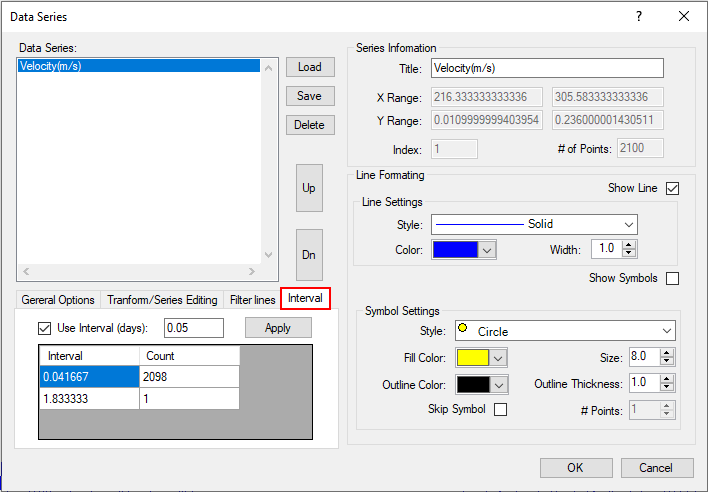
Figure 8. Interval options.
...