...
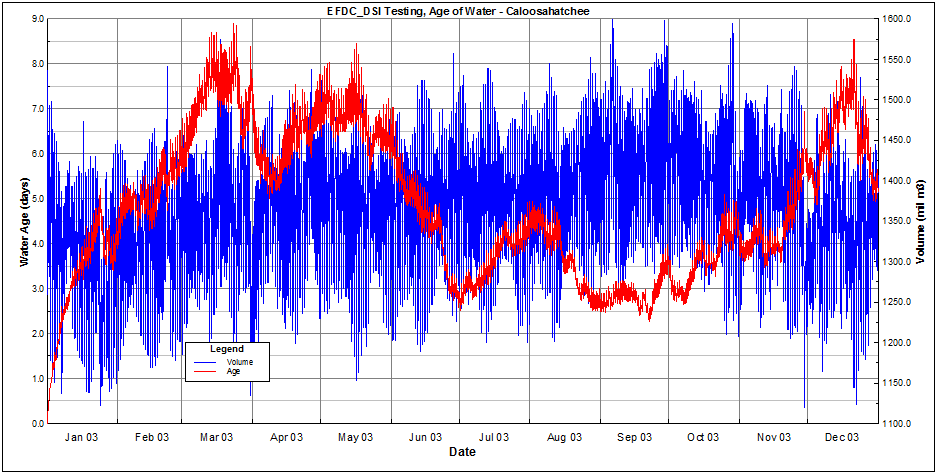
Once the time series extractions have been completed EE will display a plot of the results. The following shows the results of the time series extraction of "Age of Water" for the entire model domain. The Age (red line) is plotted against the left axis, the volume of water is plotted against the right axis.

The user can then extract the data as an ASCII file or filter the data (press F2 to see options). The ASCII extraction tool is highlighted below:
...