...
Important options are provided in the "Other key strokes" section. These include the ability to display lines as cumulative distribution functions (CDFs) using Alt Ctrl+ C.
Table 1 Time Series keystroke function summary.
...
- Ctrl+C: Show line as CDF's (Cumulative Distribution Functions). After press this keys combination, the time series plot will be converted to cumulative distribution plot immediately as shown in the Figure 4. To exit cumulative distribution plot, press Ctrl+C again.
Anchor Figure 4 Figure 4 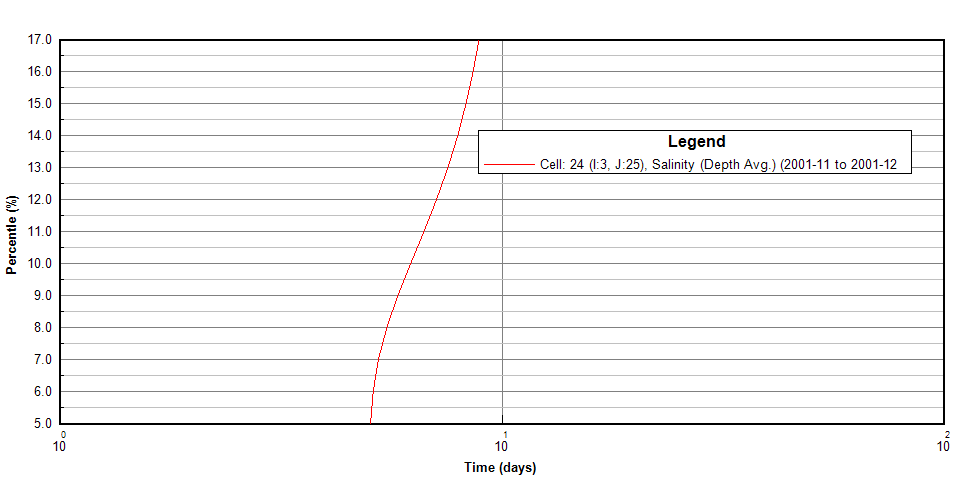
- Ctrl+S: This shortcut key allows to view statistical report of time series. Press this keys combination, a form of Line Statistics pops up as shown in Figure 5, enter average period (e.g 1, 1 D) then click OK button. Line statistical report of the time series will be shown in Figure 6. There are three options on the left top corner for save the report to a file (*.html), copy the content of report to clipboard or edit report.
Anchor Figure 5 Figure 5 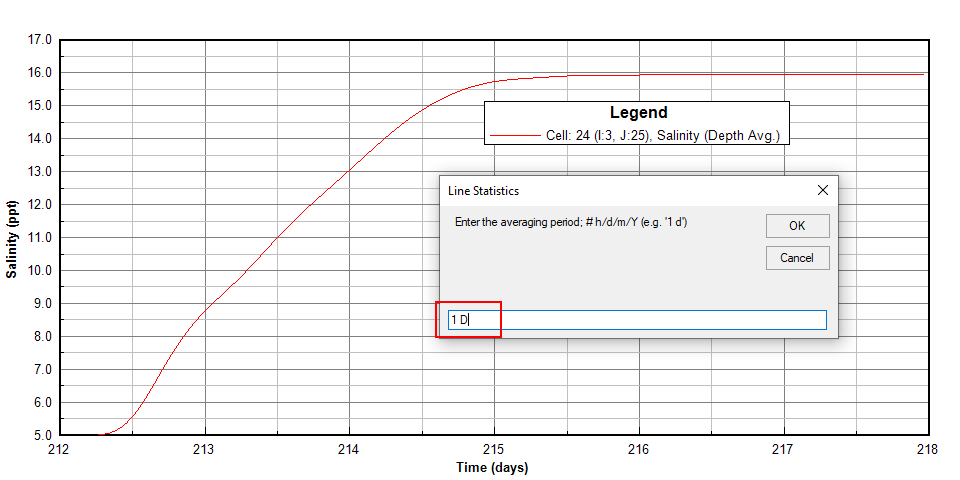
Anchor Figure 6 Figure 6 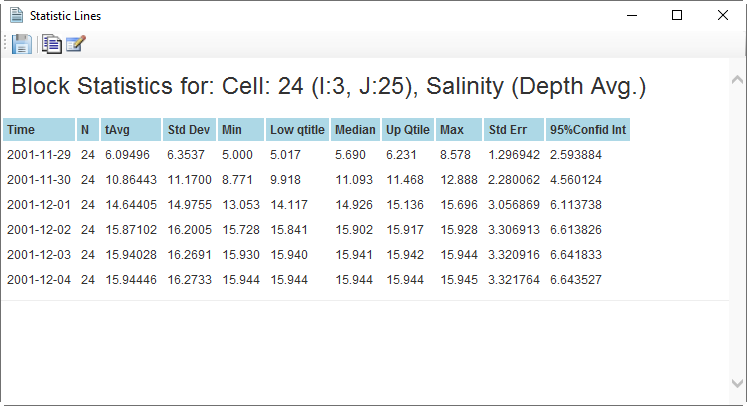
- Ctrl+A: This shortcut key allows to compute the averages statistics for the time series. Press this keys combination, a report of lines statistics pops up as shown in Figure 7.
Anchor Figure 7 Figure 7 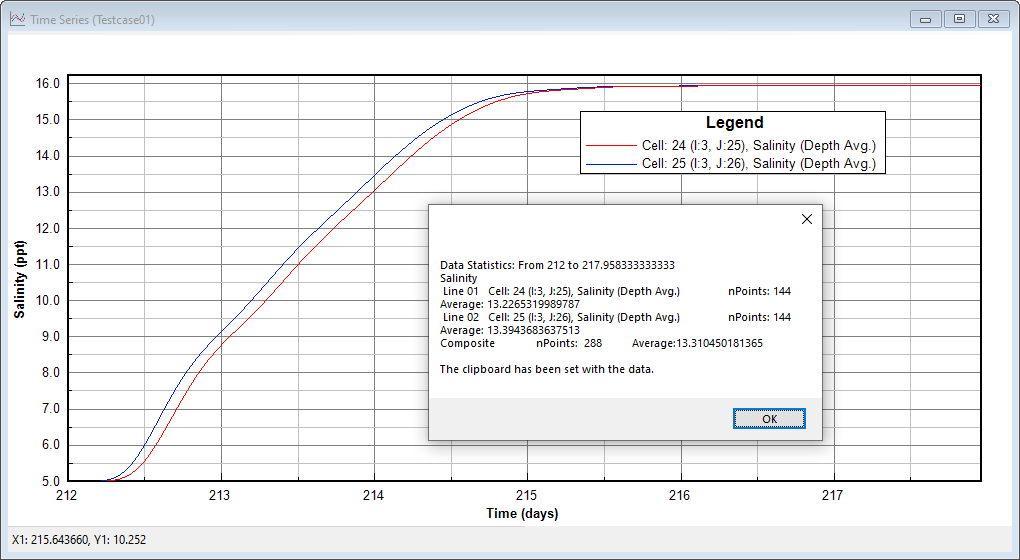
- Ctrl+B: The shortcut key allows the user to view the statistics of a time series. After pressing this key combination, the Line Statistics form is displayed as shown in Figure 8, For example, enter (0, 1 D) as shown in Figure 9 then click the OK button. The statistics for the time series will be displayed as shown in 535494720 Figure 10. Enter (1, 1 D) as shown in 535494720 Figure 11 then click the OK button. Statistics of the time series will be displayed as shown in 535494720 Figure 12. Each individual box and whisker diagram in the plot represents the minimum, 25th percentile, median, 75th percentile and maximum values corresponding to time block statistics. In this example the time block statistic is set to one day (1 D). To exit the box-whisker plot tool, press Ctrl+B again.
...
In some cases there are two or more time series on a plot (e.g. one time series represents the model output, the other represents measured data) as shown in 535494720 Figure 13. If the user wants to compare them by using a box-whisker plot they should select Ctrl+B so that the Box & Whisker Options will be displayed. Select the checkbox of the time series to display as a box and whisker plot (e.g. tick the checkbox for Data) as shown in 535494720 Figure 14. Click OK and Line Statistics form is displayed as shown in 535494720 Figure 15. Enter the box and whisker plot type and averaging period (e.g. 0, 1 D) and select OK button. Only the data will be displayed as a box and whisker plot as shown in 535494720 Figure 16. In the case two checkboxes (535494720Figure 14) are checked then both lines will be shown as box and whisker plots as shown in 535494720 Figure 17.
| Anchor | ||||
|---|---|---|---|---|
|
...
- Ctrl+I: This shortcut key allows to compute the Volume/Mass Integration for the time period. of the time series. Press this keys combination, a form of Time Series Integration pops up as shown in 535494720 Figure 18. Enter the factor on the form then click OK button, result of volume/mass will be shown in the 535494720 Figure 19.
| Anchor | ||||
|---|---|---|---|---|
|
...
- Ctrl+L: This shortcut key allows to compute the percentage of time the Y values less than a specified level. Press this keys combination, a form of Series Analysis pops up as shown in 535494720 Figure 20. Enter the level on the form then click OK button (e.g enter the level is 9), the result will be shown in the 535494720 Figure 21. In this example, the percentage of time having salinity is less than 9 ppt contributes 18.06% of entire time period of the time series.
...
- Ctrl+N: This shortcut key allows to toggle the moving averages. Press this keys combination, a form of Series Analysis pops up as shown in 535494720 Figure 22. Enter the timestep and block time on the form then click OK button (e.g enter 1, 24), the result will be shown in the 535494720 Figure 23.
| Anchor | ||||
|---|---|---|---|---|
|
...
- Ctrl+W: This shortcut key allows to set time series plot size. Press this keys combination, a form of Set Window Size pops up as shown in 535494720 Figure 24, enter new window size on the form then click OK button the size of plot will be changed immediately.
...