...
Step 6: Post Processing:
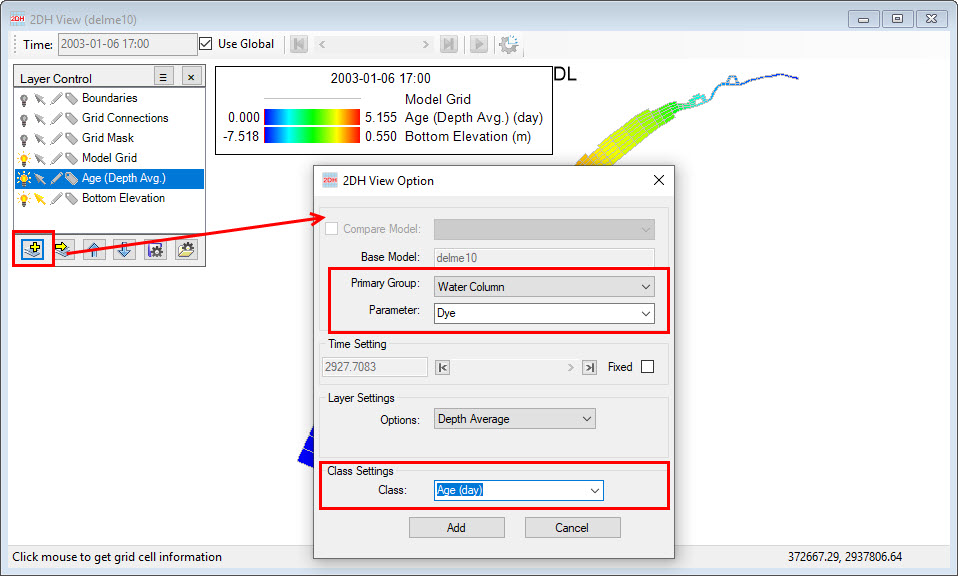
Go to ViewPlan and select the Water by Layer option, then select the Other | Age sub-option 2DH View window and select Add New Layer button will bring up 2DH View Option form. From 2DH View Option form, select Water Column in Primary Group frame, Dye for Parameter, in Class Settings frame, select Age (day) class to add Age of water layer in 2DH View . The user can generate animations, longitudinal profiles, vertical profiles, etc. as with any water column constituent.
Step 7: Post Processing: Generate Time Series of Mass Weighted Age
Once the user is viewing the Age of Water option (see Step 6) they may want to generate a time series of the average age of water for the whole model or some selected area. This can be done by select Age layer under Layer Control form then selecting the Model Volume Statistics tool tool from the top toolbar (see below).
When the tool is selected, EE will ask a series of questions:
...
Answer "Yes" to this to browse to a polygon to select the user desired region. If the user answers "No" EE will use all of the cells that are currently in the view. To include the entire model domain in the time series of the mass weighted age, the user must ensure the entire model domain is displayed.
 EE will ask if the user if they want to generate a time series. If "No" is selected EE will summarize the current time and display the model min, max and average WC value, in this case "Age of Water" in days. If the answer is "Yes" EE will then ask the user for the time period to extract
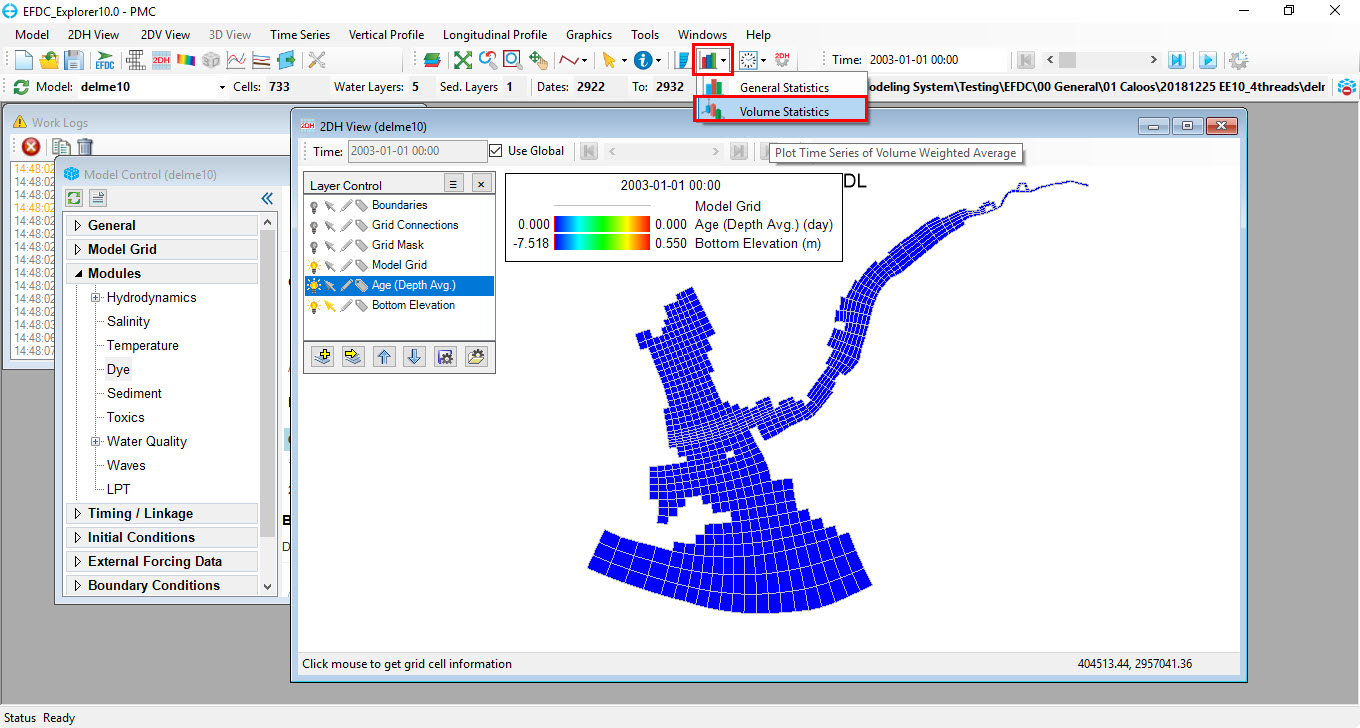
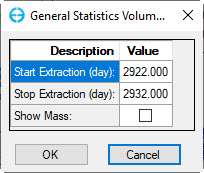
EE will pop-up General Statistic Volume Start/Stop form which allows user define the extract time period. The initial default is the entire model simulation period. However, the user can select only the period of interest.  Moreover, user can select show mass loading or not by select checking or unchecking on Show Mass checkbox.
Once the time series extractions have been completed EE will display a plot of the results. The following shows the results of the time series extraction of "Age of Water" for the entire model domain. The Age (red line) is plotted against the left axis, the volume of water is plotted against the right axis.
...