The table below is an example for harmonic constituents for Trakhuc estuary.
Name | Speed(deg/hr) | Amplitude (m) | Phase (s) |
|---|---|---|---|
| Q1 | 13.3987 | 0.04 | 126.073 |
| O1 | 13.943 | 0.261 | 146.432 |
| P1 | 14.9589 | 0.097 | 182.577 |
| K1 | 15.0411 | 0.293 | 185.991 |
| N2 | 28.4397 | 0.04 | 59.376 |
| M2 | 28.9841 | 0.185 | 75.861 |
| S2 | 30 | 0.072 | 114.865 |
| K2 | 30.0821 | 0.025 | 95.187 |
EE10 allows the user toe add these harmonic constituents for use in the open boundary condition by following these steps:
1. In External Forcing Data, Right Mouse Click RMC on Harmonic Tides and select Add New Data Series
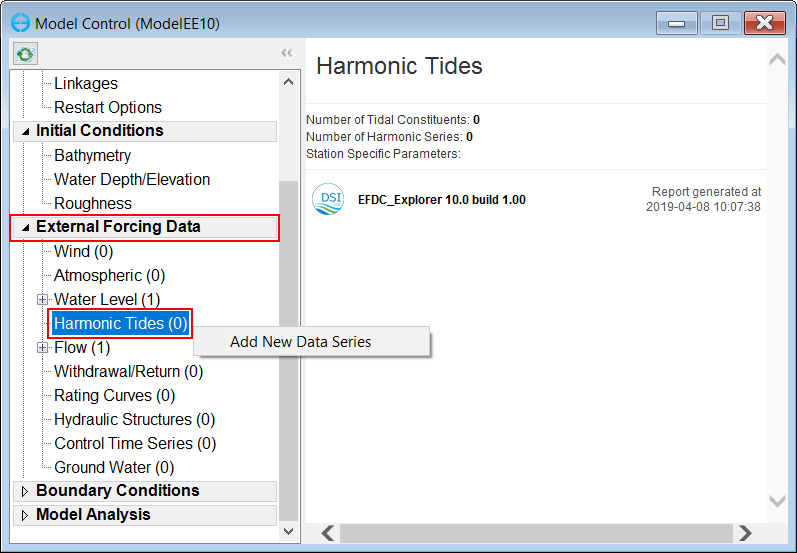
Figure 1 1. Assigning tidal boundary conditions.
2. Select Add New button to create new series
3. Enter the name in Current Series, as "Tides"
4. Select Change to add the harmonic constituents, in the this case there are 8.
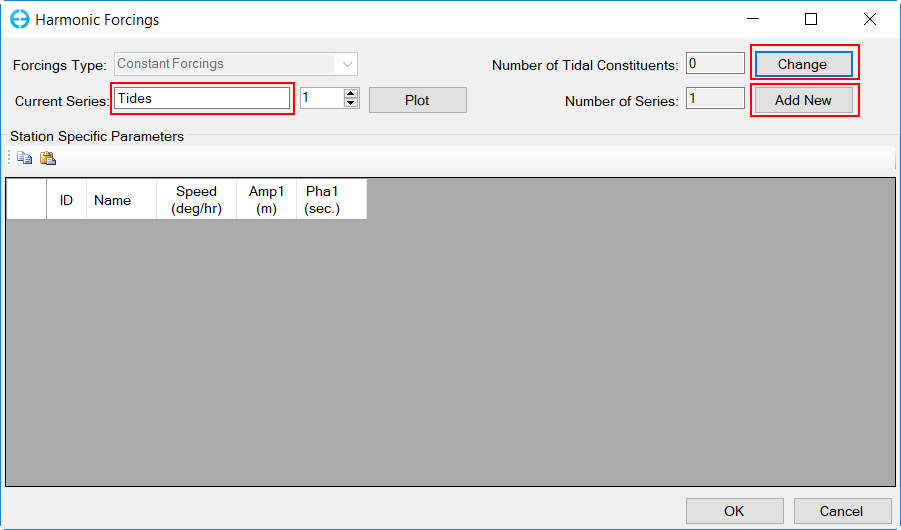
Figure 2 2. Add new tidal boundary series.
5. In here, the user enter the Enter the name of harmonic constituents (Q1, O1,...) in the Search box and select Search and add Harmonic Constituent
6. Click Ok when all 8 harmonic constituents have been added
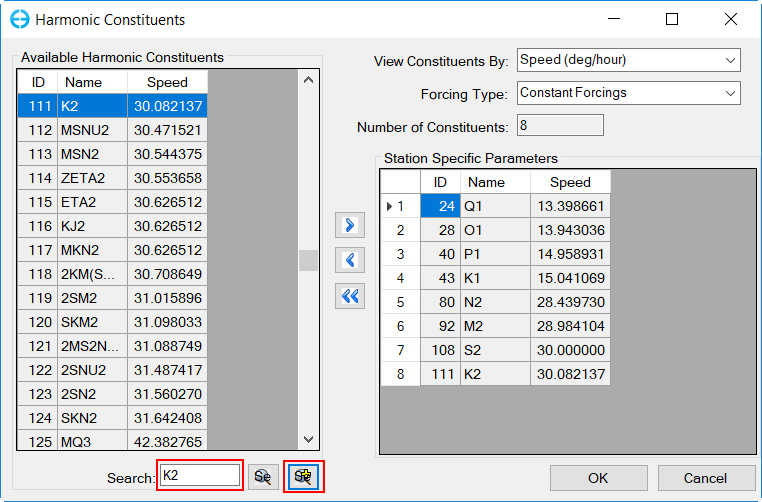
Figure 3 3. Add harmonic constituents.
7. Copy the tidal constituent values (amplitude, phase) from above table into the form form.
8. You may want to click Click Plot button to see the tidal time-series plot as shown in Figure 5
9. Click OK button to finish
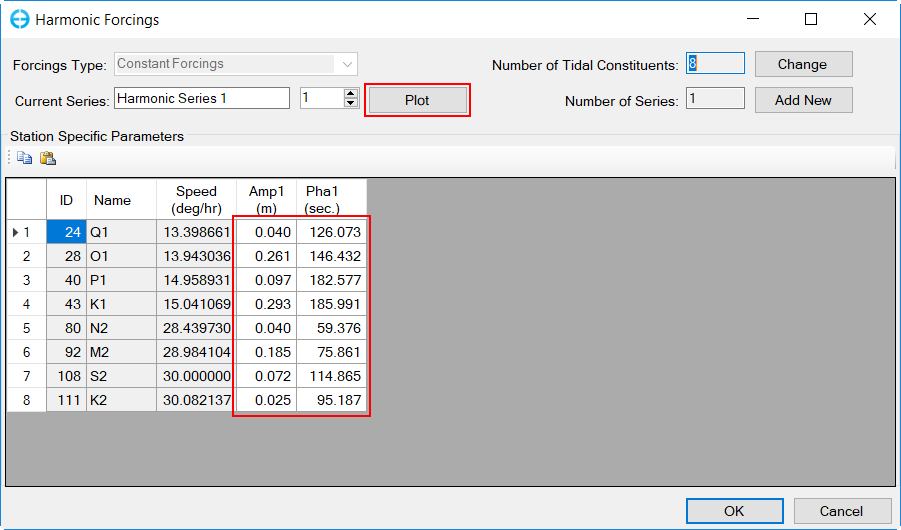
Figure 4 4. Add harmonic constituent values.
Anchor Figure 5 Figure 5
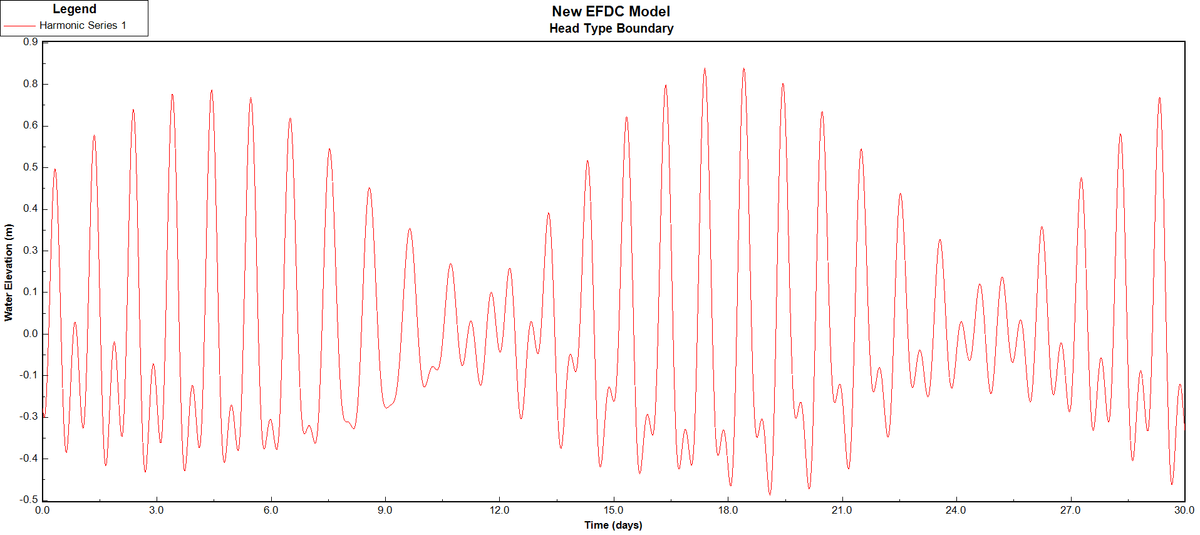
Figure 5 Tides Series Plot5. Tides series plot.
Assign
TidesTidal Boundary
To assign these tides to the open boundary cells, steps are introduced in section 4.3.2 (Build a 3D Coastal Model (Level 2 Step-by-Step Guidance). However, instead of choosing tidal series for Pressure, the user selects the series for Harmonic as shown in Figure 6
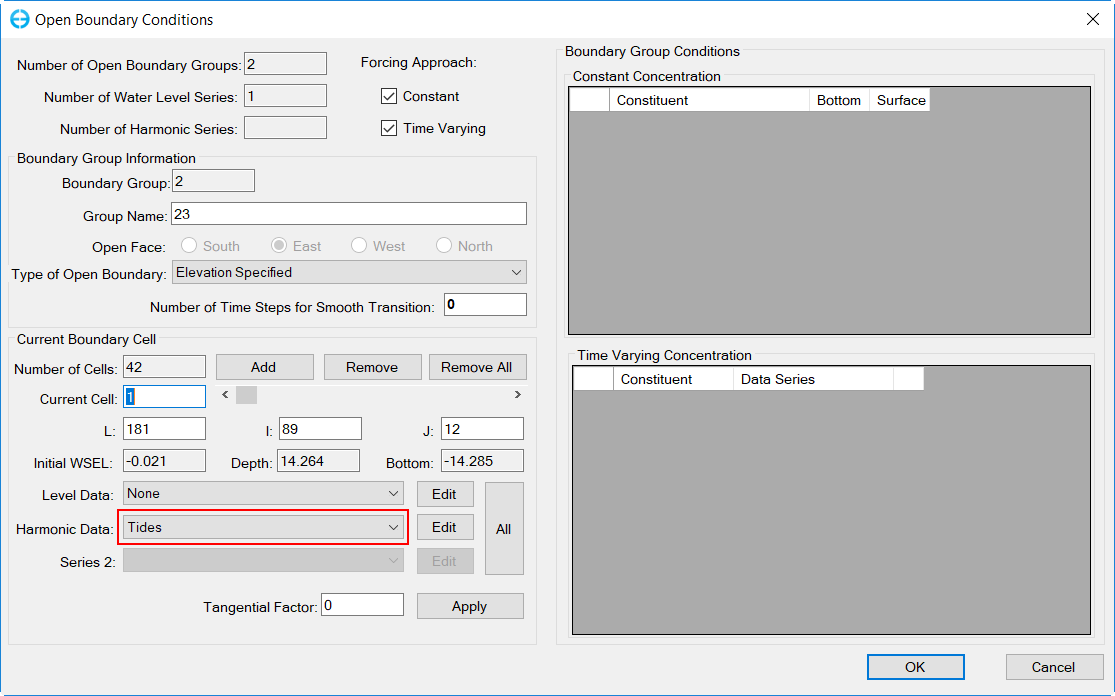
Figure 6 6. Assign tides boundary