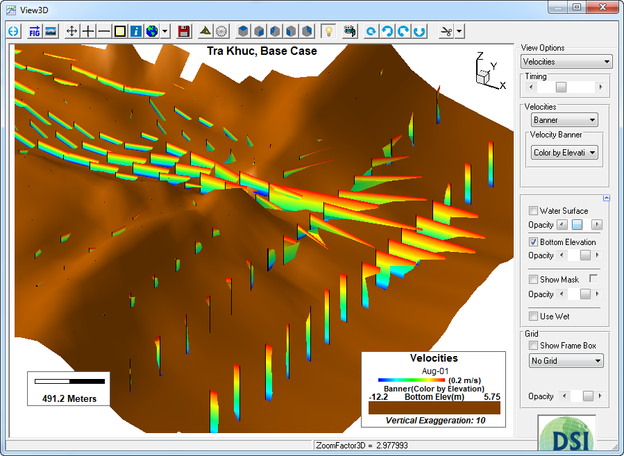
The Velocity Banner feature is accessed from the Viewing Options in View3D. Effectively this displays the 3-D velocities in a profile for each cell, something like a "wind sock", which may be colored by depth or magnitude. A pole runs between the bottom and water surface from which the velocity profiles face in different directions as shown in Figure 1.
The user may fix the color of the banner using the Display Options | 3D View tab | 3D Color Ramp Options.
| Anchor | _Ref409696984 | |||
|---|---|---|---|---|
| _Ref409696984 | ||||
| Anchor | ||||
|
Figure 1 View3D: Velocity Profiles.
The user should navigate to Display Options | 3D View | Velocity Banner Options tab to set where the profiles begin and set the frequency that they are displayed on the grid. The user may also set the color of the pole and pole thickness as shown in Figure 2.
...
| Anchor | _Ref409697018 | |||
|---|---|---|---|---|
| _Ref409697018 | ||||
| Anchor | ||||
|
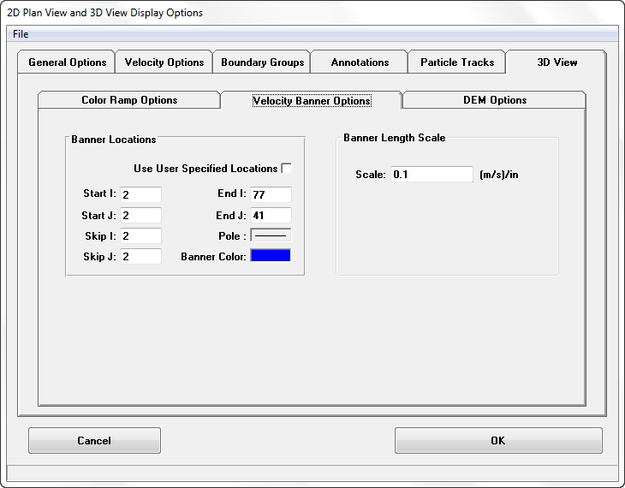
Figure 2 View3D: Velocity Profiles display options.
...