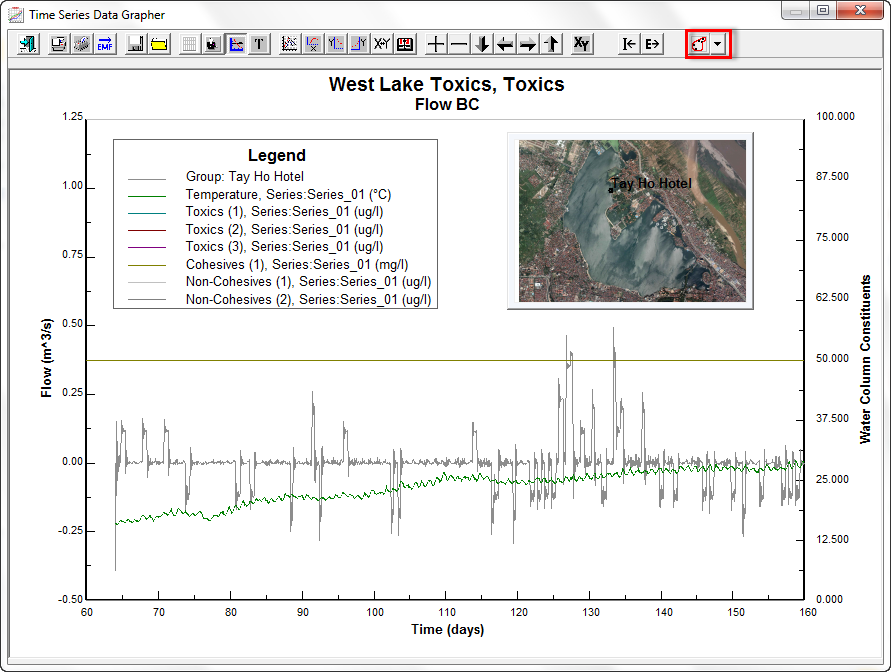
A new function in the Time Series Plotter is the ability to add a sub-frame with a geo-referenced map and annotations to illustrate the locations of time series stations. This is accessed with the "Show Plan Annotations" button in Figure 1. Options from this button include setting the Plan Annotation Options which has the same function as the Annotation tab in the 2D Display Options in ViewPlan. Here the user may select posting or label files, as well as overlay files to be loaded and displayed in the sub-frame as shown in in Figure 1 . Other options in the dropdown button include zoom to extents, load or hide a geo-referenced background, and hide or display the Annotation viewer. The Save picture option allows the user to save the sub-frame as a .jpg file.
| Anchor | _Ref409783113 | |||
|---|---|---|---|---|
| _Ref409783113 | ||||
| Anchor | ||||
|
Figure 1 TSP: Show Plan Annotations Feature.