There are two ways of using the vertical profile tool from the Vertical Profile button on the 2DH View main toolbar. These are to plot a vertical profile with or without having first selected the cells to be displaydisplayed. These are described below.
When the use user selects Vertical Profile on the main menu then select New Vertical Profile or clicks on  symbol from the main toolbar the Vertical Profile form appears as shown in Figure 1. In the Selected Cells frame, the user should enter the number of cells (#) that will plot profiles, then enter. For each cell to be plotted the index for L or I and J of the cells should be entered. Then check on the box in the last column. In Define Parameter to Plot frame, select parameter from Primary Group and Parameter. Check or uncheck on Add Water Surface and Bottom Elevation box allows to show on/off water surface and bottom elevation on the vertical profile plot. Then click
  , the selected parameter is added to Parameters to Plot frame. In this frame, the user can arrange the order of the parameters on the plot by using Up and Dn (Down) buttons. Click the OK button to finish and generate the plot.
The Save and Load buttons allow the user to save out the vertical profile layout setting to a file (VPLayout.VPL) in the #analysis folder as default. This can the then be loaded for for use at other times.
In case, we want to compare the model result to measured data, click the Browse button to browse the data file. If we don't want to model result to data, we should clear the data file path for the Data File then click the Update button before clicking the OK button.
| Anchor | ||||
|---|---|---|---|---|
|
...

Figure 1. Blank Vertical Profile form.
An example for a selected cell and its parameter The vertical profile plot of the selected cell compared to data is shown in Figure 2, vertical profile plot is shown in Figure 3.
| Anchor | ||||
|---|---|---|---|---|
|


Figure 2. Vertical Profile form with selected cell.Anchor Figure 3 Figure 3

Figure 3. Vertical Profile plotplot of water temperature.
The user also has the option of selecting multiple cells from the 2DH View. The process for cell selection is described in Grid Cell Selection), the user then selects Vertical Profile and the Vertical Profiles form will appears appear with the available number of cells in Selected Cells frame as shown in Figure 43. Alternatively, the cells may loaded may be loaded from a file in the Selected Cells frame. A vertical profile plot for multiple cells is shown in Figure 54.
Anchor Figure 43 Figure 43

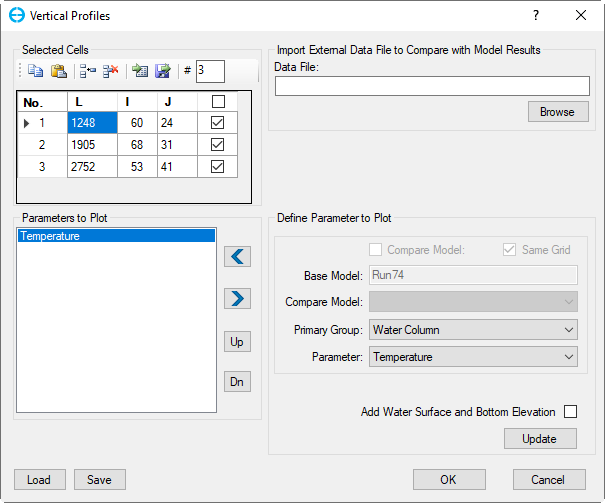
Figure 43. Vertical Profile form for cell selection in advance.
Anchor Figure 54 Figure 54


Figure 54. Vertical Profile plot for multiple cells.
The vertical profile plots use a similar graphing utility as the time series, so the user can RMC on various elements of the plot (axes, title, legend) to edit and re-configure them. RMC on the legend will show the Line Settings form as shown in Figure 65, which is identical in function with the Data Series form covered in Series Options.

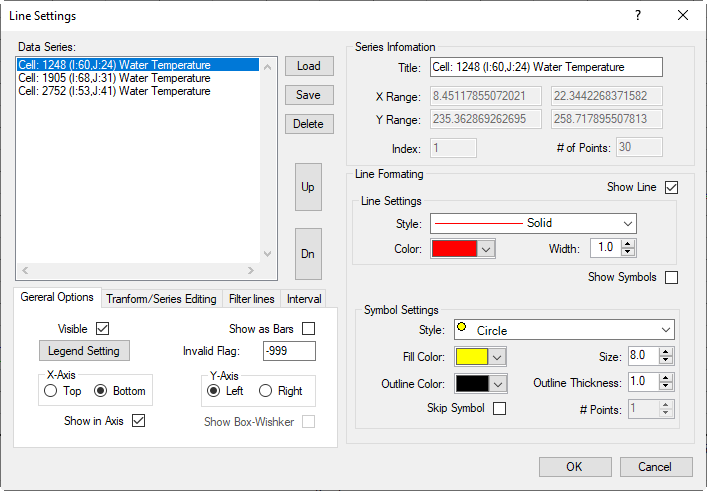
Figure 6. Line Settings form.
...