...
| Name | Explanation |
|---|---|
| Time of Start (Days) | Number of Julian days after base date at which to start simulation. |
# Reference Periods | Total simulation time as a multiple of reference periods. |
| Duration of Reference Period (hours) | Reference period is usually 24 hours however can be set to another value if the requires. |
| Time Step (second) | Also called Delta T, the EFDC model simulation time step. |
| Safety Factor | 0 is fixed time step, set 0< safety factor <1 to activate the dynamic time step feature. |
| # Ramp-Up Loops | Number of initial iteration to hold the time step to a constant during ramp-up. |
| Maximum dH/dT | If >0 then it is additional criteria to determine the dynamic time step. |
| Beginning Date/Time | The base date of all data and the simulation period. |
3. Select the EFDC_Explorer Linkage tab and set Link EFDC Results to EFDC_Explorer and set Linkage Output Frequency to 60 minutes. This means that EFDC will record the output every 60 minutes for display of the model results in the EE. (Figure 24). Note that a smaller output frequency will create a larger output file.
Anchor Figure 24 Figure 24
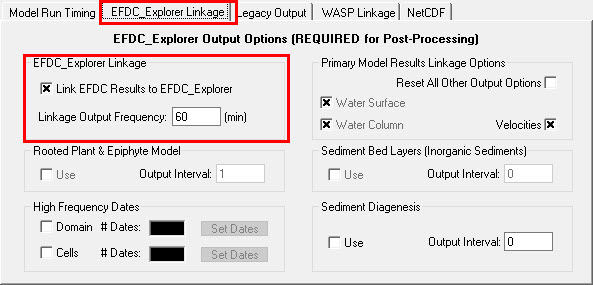
Figure 24 Setting linkage output frequency.
6. Setting Wetting and Drying
In order to optimize simulation time it is recommended to apply the EFDC model’s wet and dry condition function. This means that dry cells are ignored in each hydrodyanmic calculation, though volume of water is kept to maintain mass balance. For this condition we should make the following settings:
1. Select Hydrodynamics / Wetting & Drying box
2. Set Flag equal to -99 to allow cell skipping.
3. Enter the Dry Depth and the Wet Depth. Note that the wet depth should always greater than the dry depth. (Figure 25). The hydrodynamic model is ready for running now. If the model simulation results are not satisfied then we may have to select Turbulence Options | Modify button to adjust the hydraulic parameters.
Anchor Figure 25 Figure 25

Figure 25 Hydrodynamic model setup.
4. Return to select Domain | Grid tab and enter the number of vertical layers required into the box. In this case we will set the vertical layers equal to 5 (Figure 26).
5. Save the project.
Anchor Figure 26 Figure 26
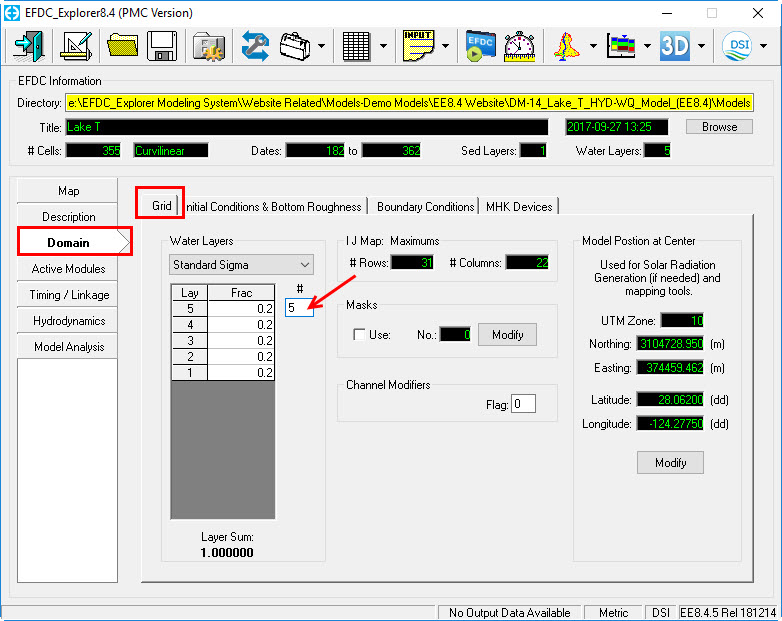
Figure 26 Setting the vertical layers.
7. Running EFDC
This section runs the EFDC model and includes following steps:
1 Select the Setting icon  on the main EE form to browse to the EFDC Executable file. (Figure 27). By default this file is in the installation folder C:\Program Files (x86)\DSI\EFDC_ExplorerXX
Anchor Figure 27 Figure 27
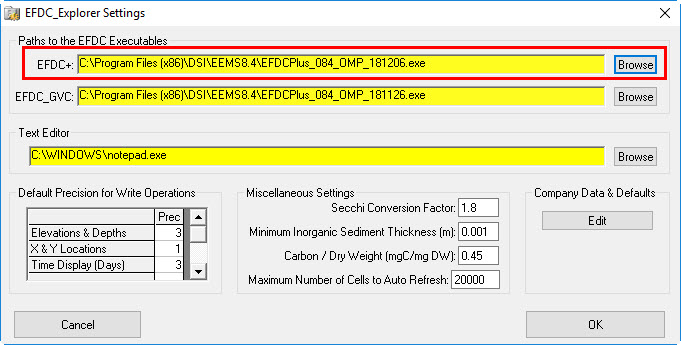
Figure 27 Browse to the EFDC executable file
Select the Run EFDC icon  on the main form and click the Run EFDC_DSI button to run the model (Figure 28).
Anchor Figure 28 Figure 28
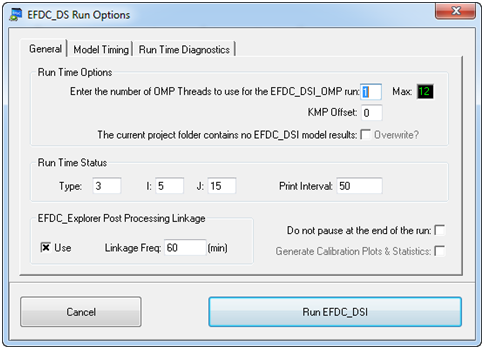
Figure 28 Run EFDC Options.
If all settings are correct, the model will start running and you will see the MS-DOS Window appear showing the model results as shown in Figure 29
| Info |
|---|
Note that you can press any characters on the keyboard to pause the simulation and check the model results. If you want to exit the simulation press the same key again, if you want to continue the run then press any other key. |
...
Figure 29 EFDC run window.
8. Visualizing the EFDC Model Output
This session will teach you how to view the model simulation results. In general, selecting these three icons  on EE’s main form (Figure 1) to view the model simulation results in ViewPlan, ViewProfile or View3D, respectively.
1. Select the ViewPlan icon as .
2. Scroll drown the Viewing Opt’s to choose the parameters for which you want to view the model results. Figure 30 is an example of showing the vector and magnitude velocity field results. Similarly, you can select other parameters to show the results.
3. Right mouse-click to the legend scale to open the ViewPlan Display Options (Figure 31)
Anchor Figure 30 Figure 30
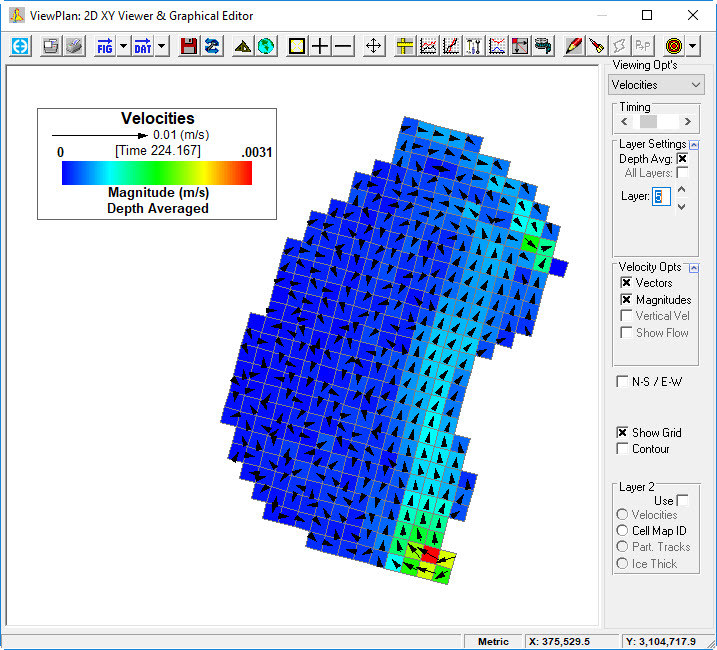
Figure 30 Visualizing the EFDC solutions.
...
Figure 31 ViewPlan Display Options.
There are a few main features in this form that are frequently used when analyzing model results. The detailed explanations for each icon are described in the Table 3.
Table 3 Description of Main Features in the Toolbar.
| Button Symbol | Explanation |
|---|---|
| To plot a time series |
| To plot vertical profiles |
| To view general statistics |
| To plot the longitudinal profiles |
| To plot the water and mass flux |
| To make an animation |
| To plot and edit a polyline |
| To extract X,Y or Im J points |
| Apply polygon selection for cell modification (Enable Edit check box need checked) |
| Copy cell property (Enable Edit check box need checked) |
Please refer to the EE Knowledge Base for more information on EE capabilities.